Featured Topics
Featured Products
Events
S&P Global Offerings
Featured Topics
Featured Products
Events
S&P Global Offerings
Featured Topics
Featured Products
Events
S&P Global Offerings
Featured Topics
Featured Products
Events
Financial and Market intelligence
Fundamental & Alternative Datasets
Government & Defense
Banking & Capital Markets
Economy & Finance
Energy Transition & Sustainability
Technology & Innovation
Podcasts & Newsletters
Financial and Market intelligence
Fundamental & Alternative Datasets
Government & Defense
Banking & Capital Markets
Economy & Finance
Energy Transition & Sustainability
Technology & Innovation
Podcasts & Newsletters
BLOG — Nov 07, 2023

By Chris Rogers
The past decade, and particularly the pandemic-era economic disruptions, show the importance of building supply chain resilience. During 2024, supply chains will continue to face challenges ranging from tariff policy and water stress to geopolitical rivalry, kinetic conflict and labor strikes, as discussed in Time, tariffs and tracking: Fourth quarter 2023 supply chain outlook.
The analysis of international trade data is an invaluable part of ensuring supply chain resilience. We provide a guide to key data types, use cases and limitations. Data types include macroeconomic reporting, bill of lading and tax documents, vessel tracking products and data exhaust from business operations.
Data types
Macroeconomic trade data is an extension of national accounts (GDP) reporting, typically handled by governmental agencies. The data tends to be monthly and published with a mixture of industry or tariff-code product tagging. Information is typically provided on a nominal (currency) and unitary (e.g. mass) basis. These are often enhanced with additional data fields including transportation mode, state or province of destination, tax regime applied and more.
Bills of lading and similar tax documents are published by authorities in many countries. These provide details on consignee (buyer) and shipper (seller) names and addresses as well as text descriptions of products shipped and transport-mode details such as freight forwarder or vessel used. Data can be published as frequently as daily.
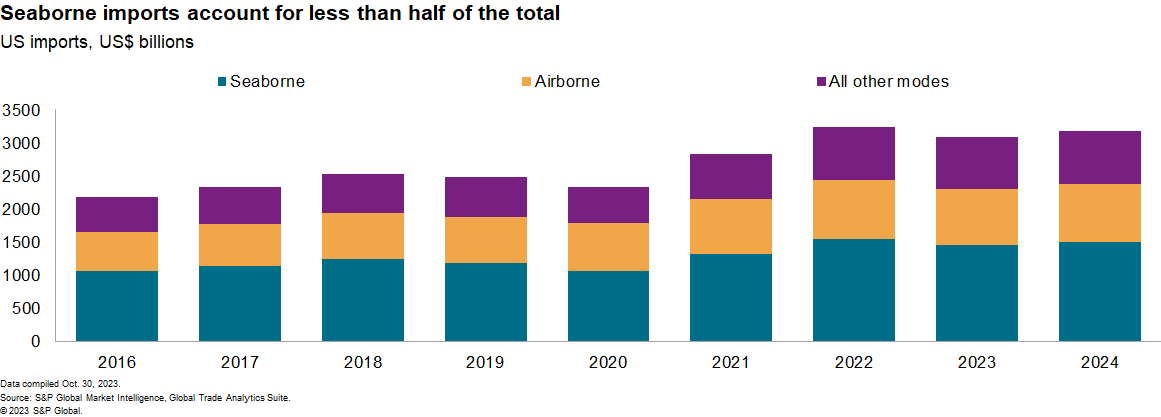
Most countries that publish bill-of-lading information provide all transportation modes. One exception is the US, due to a quirk of legislation where sea freight is covered but not air freight or other modes, limiting publishing to 47.2% of trade by value in 2022, according to our estimates. Reduced modal coverage limits the validity of all use cases.

The growth of the vessel tracking industry has opened up a third class of data, focused on the physical infrastructure including satellite-based ocean vessel tracking and call-sign based airplane tracking. Details on goods and counterparties are not available, but the data is updated in near real-time with geotagging characteristics. Related datasets include vessel ownership data, which can be used when analyzing parties involved in a given shipment.
A wide range of, typically private sector, "data exhaust" sources of information are also available, ranging from seaport reporting to freight forwarder activity aggregates and financial data. These have an inconsistent range of reporting characteristics but can provide additional insights and cross-checks for other data types.
Learn more about our Supply Chain Console
Use cases
Bad actor identification use cases are the most socially useful and include identifying import duty and sanctions evasion, detecting human rights abuses, and delivering environmental policy objectives. As well as initial investigations, trade data can be used to track changing behaviors, for example the types of products exported from regions with alleged human rights abuses.
Bill-of-lading data is particularly useful for creating supply chain network graphs, mathematical models of the relations between companies and products. Uses include identifying suppliers and customers (across manufacturers, retailers and logistics firms), analyzing competitors (both corporate and national), reasons for shortages of goods, and tracing the impact of shocks to suppliers and customers.
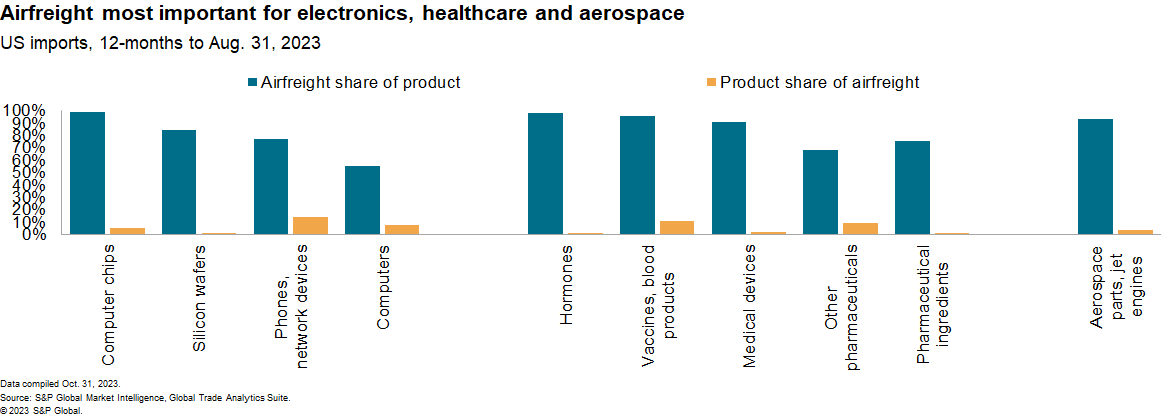
The inclusion of airfreight data is vital for the network graphs of critical products including computer chips (98% of US imports came by air in the past 12 months), vaccines (95%) and aerospace parts (93%), among others.

The different types of trade data can be combined to enhance economic forecasts as well as track corporate activity. The data can also be used to augment risk mitigation within capital allocation including anomalous activity alerts, counter-party risk profiling and exogenous shock propagation for both corporate and financial sector players.
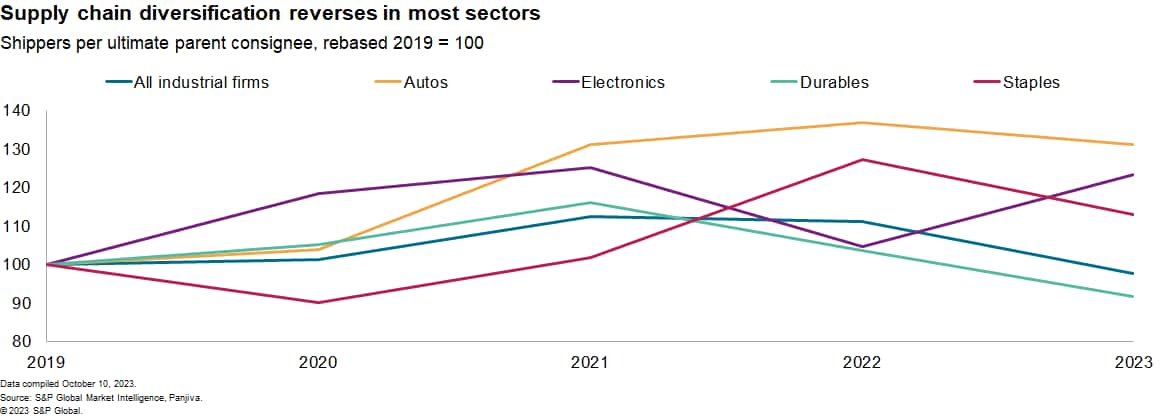
Building supply chain resilience requires identifying alternative sourcing opportunities. The combination of trade data with economic risk, pricing and other measures can create sourcing attractiveness scores. Trade data can also be combined with other datasets to track sourcing diversification -- which is falling -- and environmental performance.

Limitations
We see reasons to be cautious when using any of the four international trade data types already identified. Most can be mitigated, and it is important to remember that even partial visibility is better than none.
By its very nature, international trade data can't cover the portion of supply chains that happen wholly within a country. The trend toward onshoring of semiconductor and electric vehicle supply chains could reduce the utility of trade data for those industries, although it is unlikely that any products will become 100% domestically produced.
The output data is only as good as the input data, particularly in the case of bills of lading. Raw commodity descriptions in the bills can be as generic as "chemicals" and as specific as "low linear-density polyethylene." Input quality can vary significantly across countries and within industries.
Finally, while some elements of malfeasance may be directly observable in trade data, it may often need to be considered in conjunction with other datasets. This can be partly mitigated by having more complete and granular trade data and highly sophisticated data analysis tools.
Sign up for our Supply Chain Essentials newsletter
This article was published by S&P Global Market Intelligence and not by S&P Global Ratings, which is a separately managed division of S&P Global.