Featured Topics
Featured Products
Events
S&P Global Offerings
Featured Topics
Featured Products
Events
S&P Global Offerings
Featured Topics
Featured Products
Events
S&P Global Offerings
Featured Topics
Featured Products
Events
Financial and Market intelligence
Fundamental & Alternative Datasets
Government & Defense
Banking & Capital Markets
Economy & Finance
Energy Transition & Sustainability
Technology & Innovation
Podcasts & Newsletters
Financial and Market intelligence
Fundamental & Alternative Datasets
Government & Defense
Banking & Capital Markets
Economy & Finance
Energy Transition & Sustainability
Technology & Innovation
Podcasts & Newsletters
BLOG — Apr 21, 2021
By Chris Suckling and Keerti Rajan
Black swan?
At the time of writing, the proximate cause of the Ever Given's grounding was a "sudden strong wind", not mechanical failure, human error, or sabotage. And six days of blockage of the canal is unusually long. Previous groundings in the Suez Canal were refloated within hours - for example, the Fabiola in 2016 and the Maersk Shams in 2015, both of which were smaller vessels. The backlog of congested vessels, which neared 400 in the Red Sea by 29 March, was largely cleared within a week but will compound delays in containerized trade between Asia, Europe, and North America. On 12 April, the Financial Times reported the head of the global ocean network at Maersk as estimating that the disruption will last into the second half of May, nearly two months after the Ever Given was refloated.
Boxed in: Pressures in containerized trade
The congestion of containerized cargo was triggered by the surge in demand for retail consumer goods observed during coronavirus disease 2019 (COVID-19) related lockdowns. With hospitality, personal services, and travel severely restricted, households in North America and Europe have increased their consumption of electronics, home furnishings, and recreational goods - all of which are transported in containers, mostly from Asia. The Suez Canal handles about one-third of the Asia-United States' east coast containerized cargo, compared with the half that traverses the Panama Canal. Asian production is dominated by mainland China, which was among the first of the major economies to resume economic activity in early 2020. The COVID-19 virus pandemic has already contributed to China's trade surplus reaching historic highs: in early 2021, it overtook the United States to become the European Union's largest trading partner. But the ability of Chinese manufacturers to meet demand has been constrained by the current scarcity of shipping containers. This is a logistical problem and not one of capacity, underscoring the complexity of supply chains. Containers have not been shipped back to China in time for reloading for the next round of exports. This current scarcity is reflected in shipping freight rates since December 2020. China's Ministry of Transportation reported that spot rates for containerized freight from China to Europe climbed 197% year on year.
Supply chain pressure in containerized trade contrasts with trade in commodities. Bulker freight rates (iron ore fixtures, Brazil-China, Australia-China) have remained within a narrow corridor of their 26-week moving average since mid-2020 - even though our Materials Price Index (MPI) has continued to rise. The key here is that there is no equivalent shortage of bulk carriers to transport commodities. The rise in the MPI began in the second quarter of 2020, driven by lower production as miners and refiners opted to leave some sites dormant in the face of significant uncertainty about the path of the pandemic, national restrictions, and associated demand for materials. It is supply-driven, not demand-disrupted.
Delays and costs: China vs. the rest
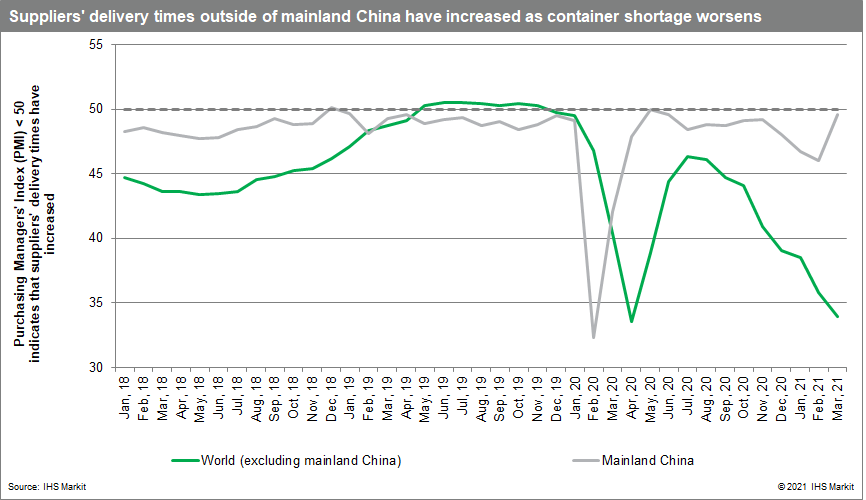
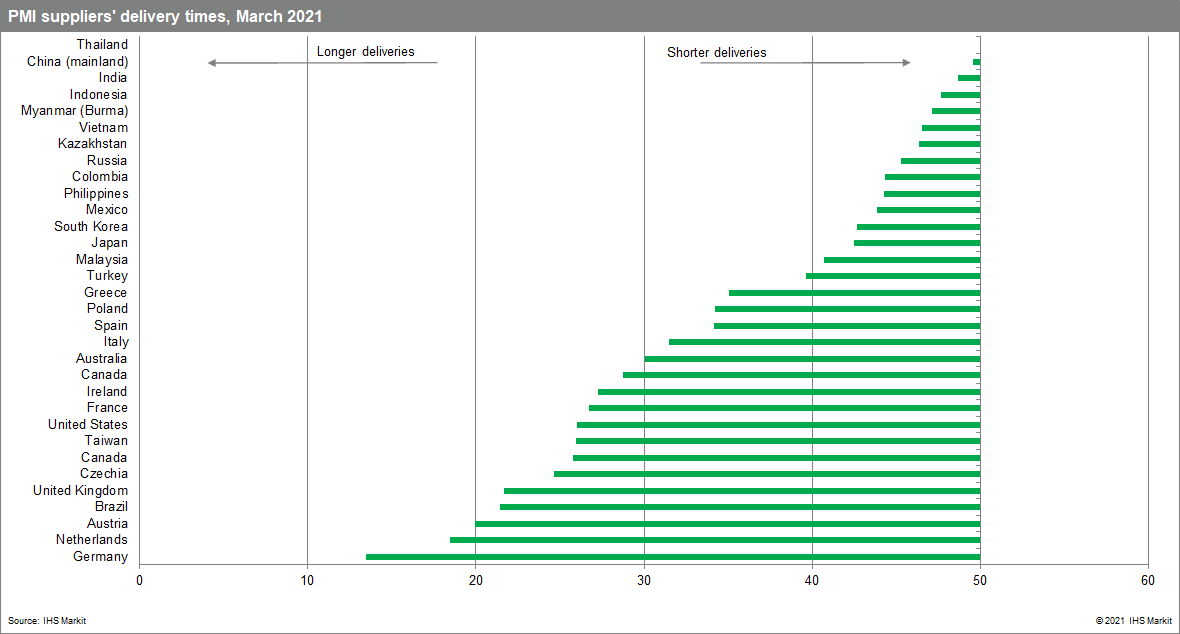
Supplier delays outside mainland China deteriorated far more than within China. With strong domestic demand and exports constrained by the scarcity of containers, Chinese manufacturers have prioritized deliveries to their domestic markets, in line with Chinese government policy priorities.

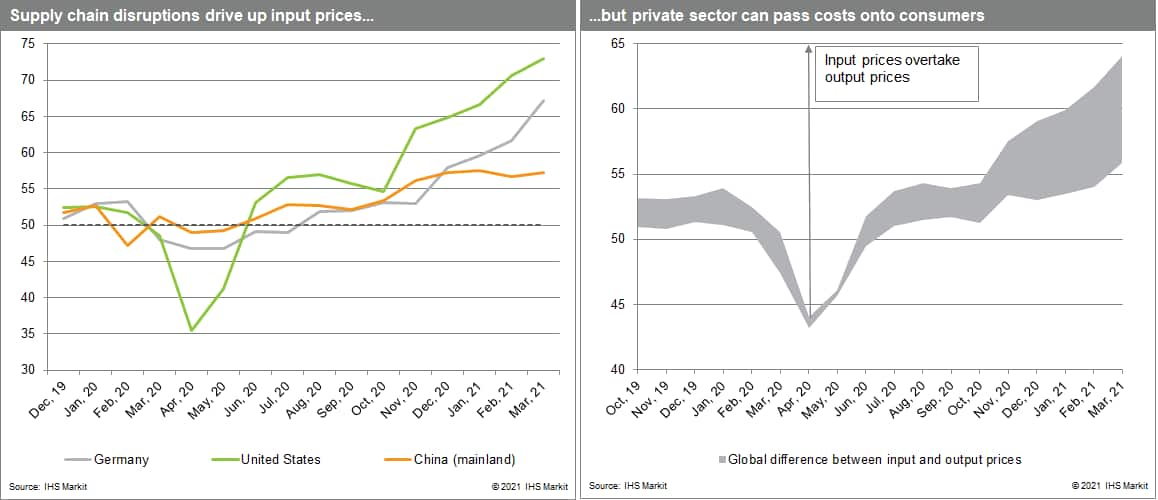
Supplier delays are translating into higher input prices too. IHS Markit's Global Purchasing Managers' Index (PMI) shows that in March 2021 average input prices rose by the most that they have in 12.5 years. They have not yet been fully passed through to clients: increases in output prices have been smaller, even if selling prices rose for the ninth consecutive month and at the fastest rate since these data were first collected in October 2009. The pass-through to output prices were higher in the US than in the Eurozone, where manufacturers, in particular, have so far absorbed some of the rises in input costs. And again, this spread reflecting supply chain pressures is narrower in mainland China.


Grey rhino: Some indicators
Supply chains were complex and tenuous before the COVID-19 virus pandemic, and have since become more so. Even once it became clear that the global — and globalized — economy would experience an unprecedented suspension of economic activity, few observers predicted the shortage of containers that is now delaying supplies and putting pressure on supply chains and prices, particularly in advanced economies in North America and Europe. Neither did they foresee that the virus would extend main China's trade surplus and once more expose the depth of advanced, Western economies' reliance on Chinese suppliers.
However, in hindsight, clues were available in the sudden shift in consumer demand patterns and the unsynchronised lifting of national restrictions, with China the first to emerge from lockdown. High-frequency materials prices data and purchasing managers' reports indicated intensifying supply chain pressures months before the black swan of the Ever Green's grounding. Supply chains are difficult to manage, but indicators are available to monitor these grey rhinos.
Posted 21 April 2021 by Chris Suckling, Associate Director, Risk Quantification, S&P Global Market Intelligence and
Keerti Rajan, Research and Analysis Director, Economics & Country Risk, S&P Global Market Intelligence