Featured Topics
Featured Products
Events
S&P Global Offerings
Featured Topics
Featured Products
Events
S&P Global Offerings
Featured Topics
Featured Products
Events
S&P Global Offerings
Featured Topics
Featured Products
Events
Financial and Market intelligence
Fundamental & Alternative Datasets
Government & Defense
Professional Services
Banking & Capital Markets
Economy & Finance
Energy Transition & Sustainability
Technology & Innovation
Podcasts & Newsletters
Financial and Market intelligence
Fundamental & Alternative Datasets
Government & Defense
Professional Services
Banking & Capital Markets
Economy & Finance
Energy Transition & Sustainability
Technology & Innovation
Podcasts & Newsletters
Research — 28 Mar, 2024

By Sean DeCoff
The declining streak of S&P Global Market Intelligence's Pipeline Activity Index came to an end in February. The index increased 11% month over month to 88; before that, it had fallen for three straight months. The gold Pipeline Activity Index was responsible for the monthly rebound, increasing 22% month over month to 115 from 94. The base/other Pipeline Activity Index posted a slight decrease in the month to 61 from 64.
Metrics used in our Pipeline Activity Index (PAI) calculation were mixed in February. There was an increase in significant drill results and positive milestones, while initial resource announcements dropped by one, and financings rebounded after an abysmal January. Most metals tracked in our Exploration Price Index declined slightly in the month, which pressured miners and subsequently led to a decline in the industry market capitalization.
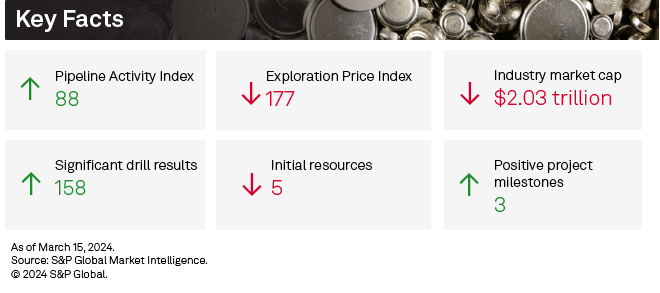
The PAI measures the level and direction of overall activity in the commodity supply pipeline by incorporating significant drill results, initial resource announcements, significant financings and positive project development milestones into a single comparable index.
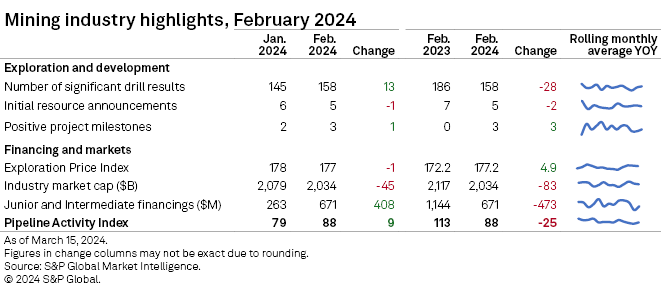
Detailed data on the PAI metrics is available in the accompanying Excel spreadsheet.
Gold, copper financings jump, but number remains low
Funds raised by junior and intermediate mining companies rebounded to $671 million in February, up 155% from the multiyear low recorded in January. Higher gold and copper financings buoyed February totals, aided by a couple of high-value transactions. Despite higher funds raised, the number of transactions continued to slide, down 18% to 132 transactions — the lowest since January 2022. The number of significant financings in February climbed to 38 from 31 in the previous month. Three transactions were valued at more than $30 million, compared with none in January.
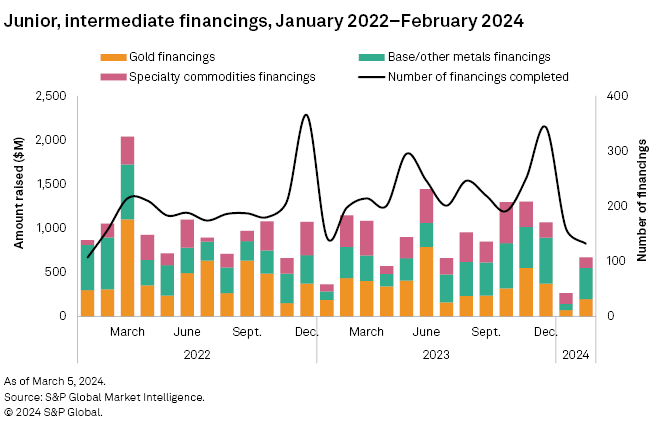
Gold financings nearly tripled to $198 million after a five-year low of $72 million in January, while the number of gold transactions rose to 68 from 60. There was one transaction valued at over $30 million, up from zero in January.
The base/other metals group jumped fivefold to $352 million in February, fueled by huge increases in copper, zinc-lead and silver financings. Despite higher funds raised, the number of transactions fell by one-third to 40 — the lowest in more than two years. One transaction was valued at over $30 million in February, up from zero in January.
Drilling metrics continue to rise
Although projects and drillholes increased month over month in February, projects were down 14% and drillholes were down 8% year over year. Drilling increased at late-stage and minesite projects in February, with late-stage increasing 1% to 122 projects and minesite projects up 33% to 65 projects, while early-stage projects dropped 1% to 109.
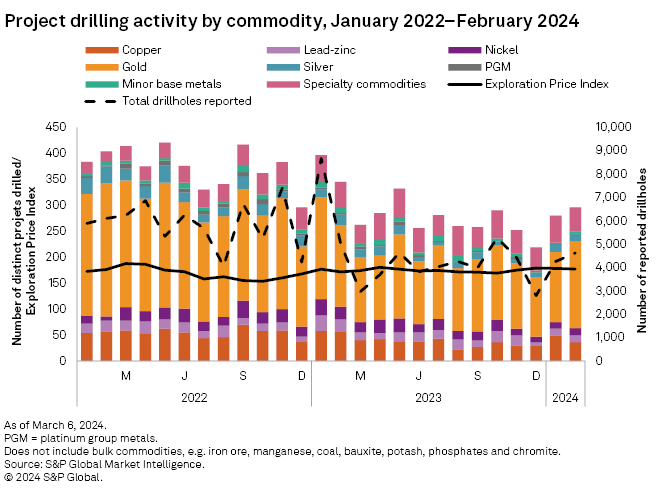
February's top result came from Toronto Stock Exchange-listed Dundee Precious Metals Inc.'s Timok gold project in Serbia, which reported an intersect of 81.0 meters grading 50.57 grams per metric ton of gold. The company recently announced an inferred mineral resource estimate of 1.8 million ounces of gold as well as positive results from a scout drilling project at two prospects north of the main deposit.
Initial resource announcements decrease by 1
There were five initial resource announcements in February — three for gold projects and two for base/other primary projects — one fewer month over month. Announced contained volumes continue to be slender, although they improved slightly compared to December 2023 and January.
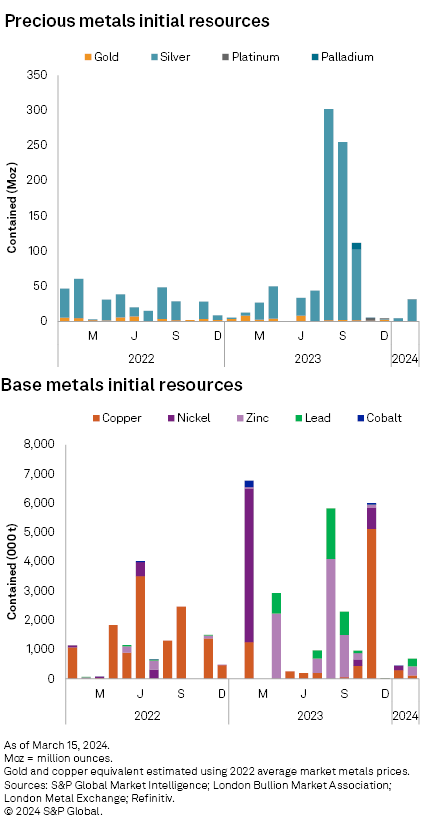
The largest base metals announcement came from Western Alaska Minerals Corp., which reported an inferred resource for the Waterpump Creek Zone at its 100% owned Illinois Creek gold project in western Alaska. The total resource came in at 2.39 million metric tons (MMt), containing 269,000 metric tons of zinc, 235,000 metric tons of lead and 21.4 million ounces of silver.
The next largest announcement came from Anglo Asian Mining PLC, which announced a maiden mineral resource estimate for the Garadagh copper deposit in Azerbaijan. Total inferred and indicated resources came in at 24.9 MMt, grading 0.48% copper, equating to a contained volume of 119,000 metric tons of copper.
3 positive milestones, 2 negative
The number of positive milestones for February came in at three — all for silver-focused projects — an increase of one compared to January. One was production-related and two were feasibility-related. There were two negative milestones in February. Like January, the negative milestones were all production-related for nickel projects.
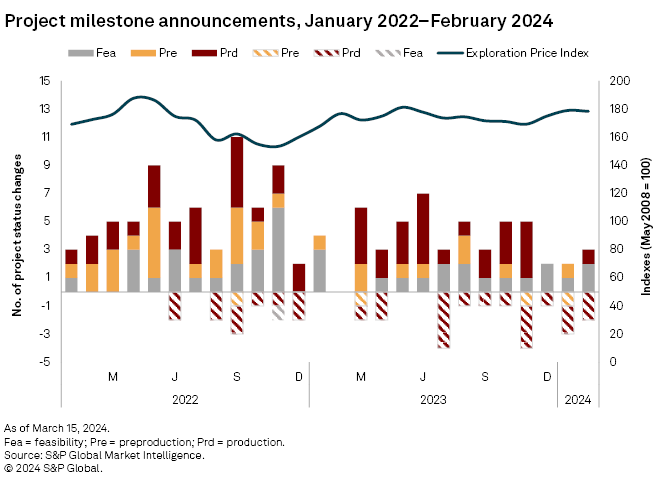
Two silver projects announced feasibility milestones in the month. South32 Ltd. said it received final investment approval for the Taylor deposit following a feasibility study confirming project viability. Taylor is the first part of the Hermosa silver project in Arizona. The second completed feasibility announcement came from Discovery Silver Corp. The company announced the result for the Cordero silver project in Chihuahua State, Mexico.
February's two negative milestones were both related to nickel projects. Mining giant Glencore PLC said the Koniambo nickel mine in New Caledonia will transition to care and maintenance. And Mallee Resources Ltd. said the Avebury nickel mine in Tasmania will transition into care and maintenance. While not necessarily the main cause, weak nickel prices were cited by both companies as a contributing factor in their respective news releases. There were three negative nickel announcements in January.
Exploration Price Index almost flat
While Market Intelligence's Exploration Price Index (EPI) registered a minor decline in February, dropping to 177, the index remained relatively strong. Gold and copper, which carry most of the weight in our calculation, were essentially flat month over month, declining only a marginal 0.5% and 0.6%, respectively. Nickel and molybdenum prices increased 1.4% and 0.9%, respectively. Zinc, platinum and cobalt registered significant declines, falling 6.4%, 3.8% and 1.7%, respectively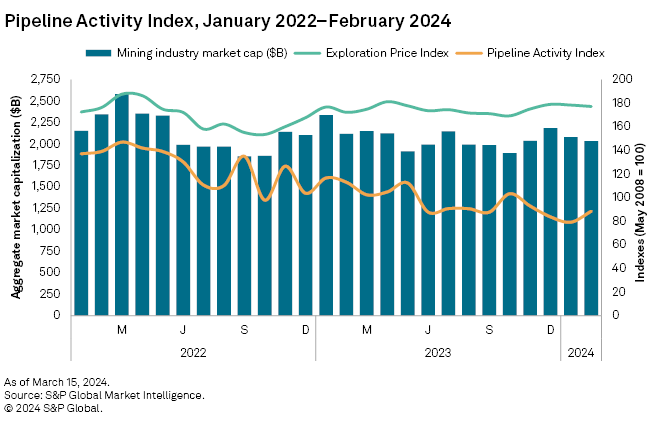
The EPI measures the relative change in precious and base metals prices, weighted by the overall exploration spending percentage for each metal as a proxy of its relative importance to the industry at a given time.
Equities fall further
Despite commodity prices remaining robust, mining equities again lost value. Market Intelligence's aggregate market capitalization of the 2,684 listed mining companies decreased 2.2% to $2.03 trillion, compared to $2.08 trillion in January.
S&P Global Commodity Insights produces content for distribution on S&P Capital IQ Pro.
This article was published by S&P Global Market Intelligence and not by S&P Global Ratings, which is a separately managed division of S&P Global.