Featured Topics
Featured Products
Events
S&P Global Offerings
Featured Topics
Featured Products
Events
S&P Global Offerings
Featured Topics
Featured Products
Events
S&P Global Offerings
Featured Topics
Featured Products
Events
Financial and Market intelligence
Fundamental & Alternative Datasets
Government & Defense
Banking & Capital Markets
Economy & Finance
Energy Transition & Sustainability
Technology & Innovation
Podcasts & Newsletters
Financial and Market intelligence
Fundamental & Alternative Datasets
Government & Defense
Banking & Capital Markets
Economy & Finance
Energy Transition & Sustainability
Technology & Innovation
Podcasts & Newsletters
BLOG — Oct 14, 2021
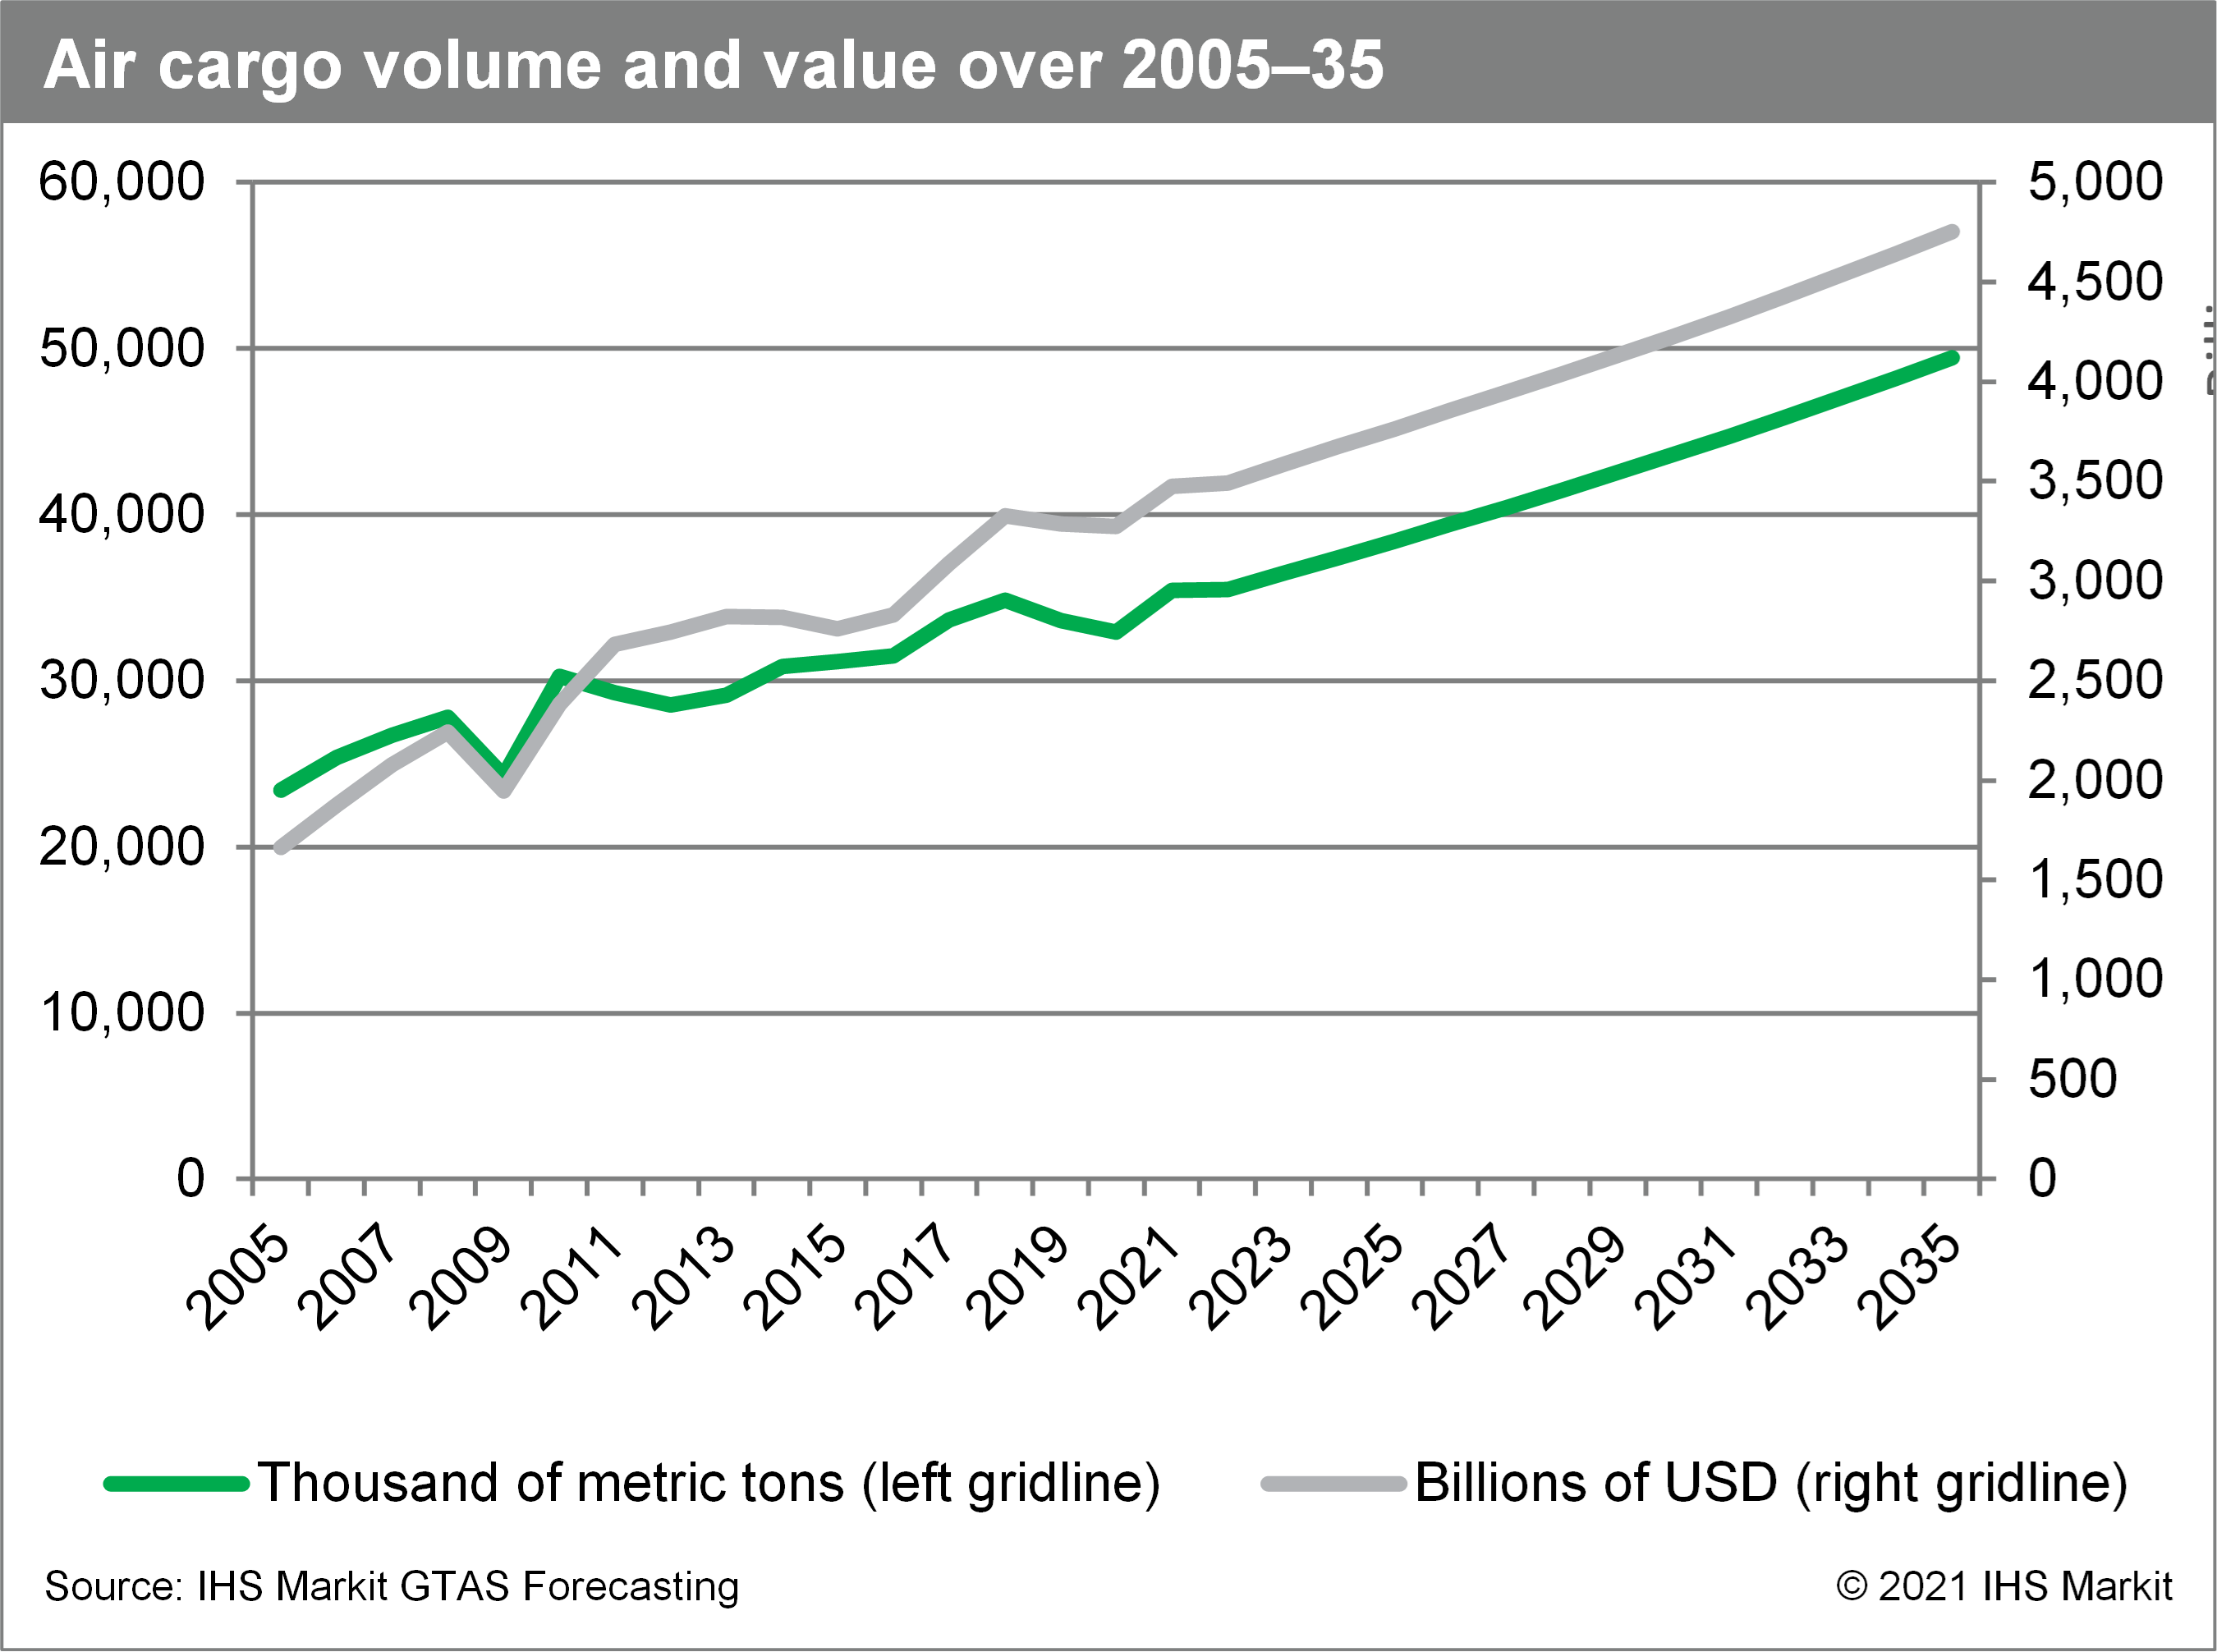
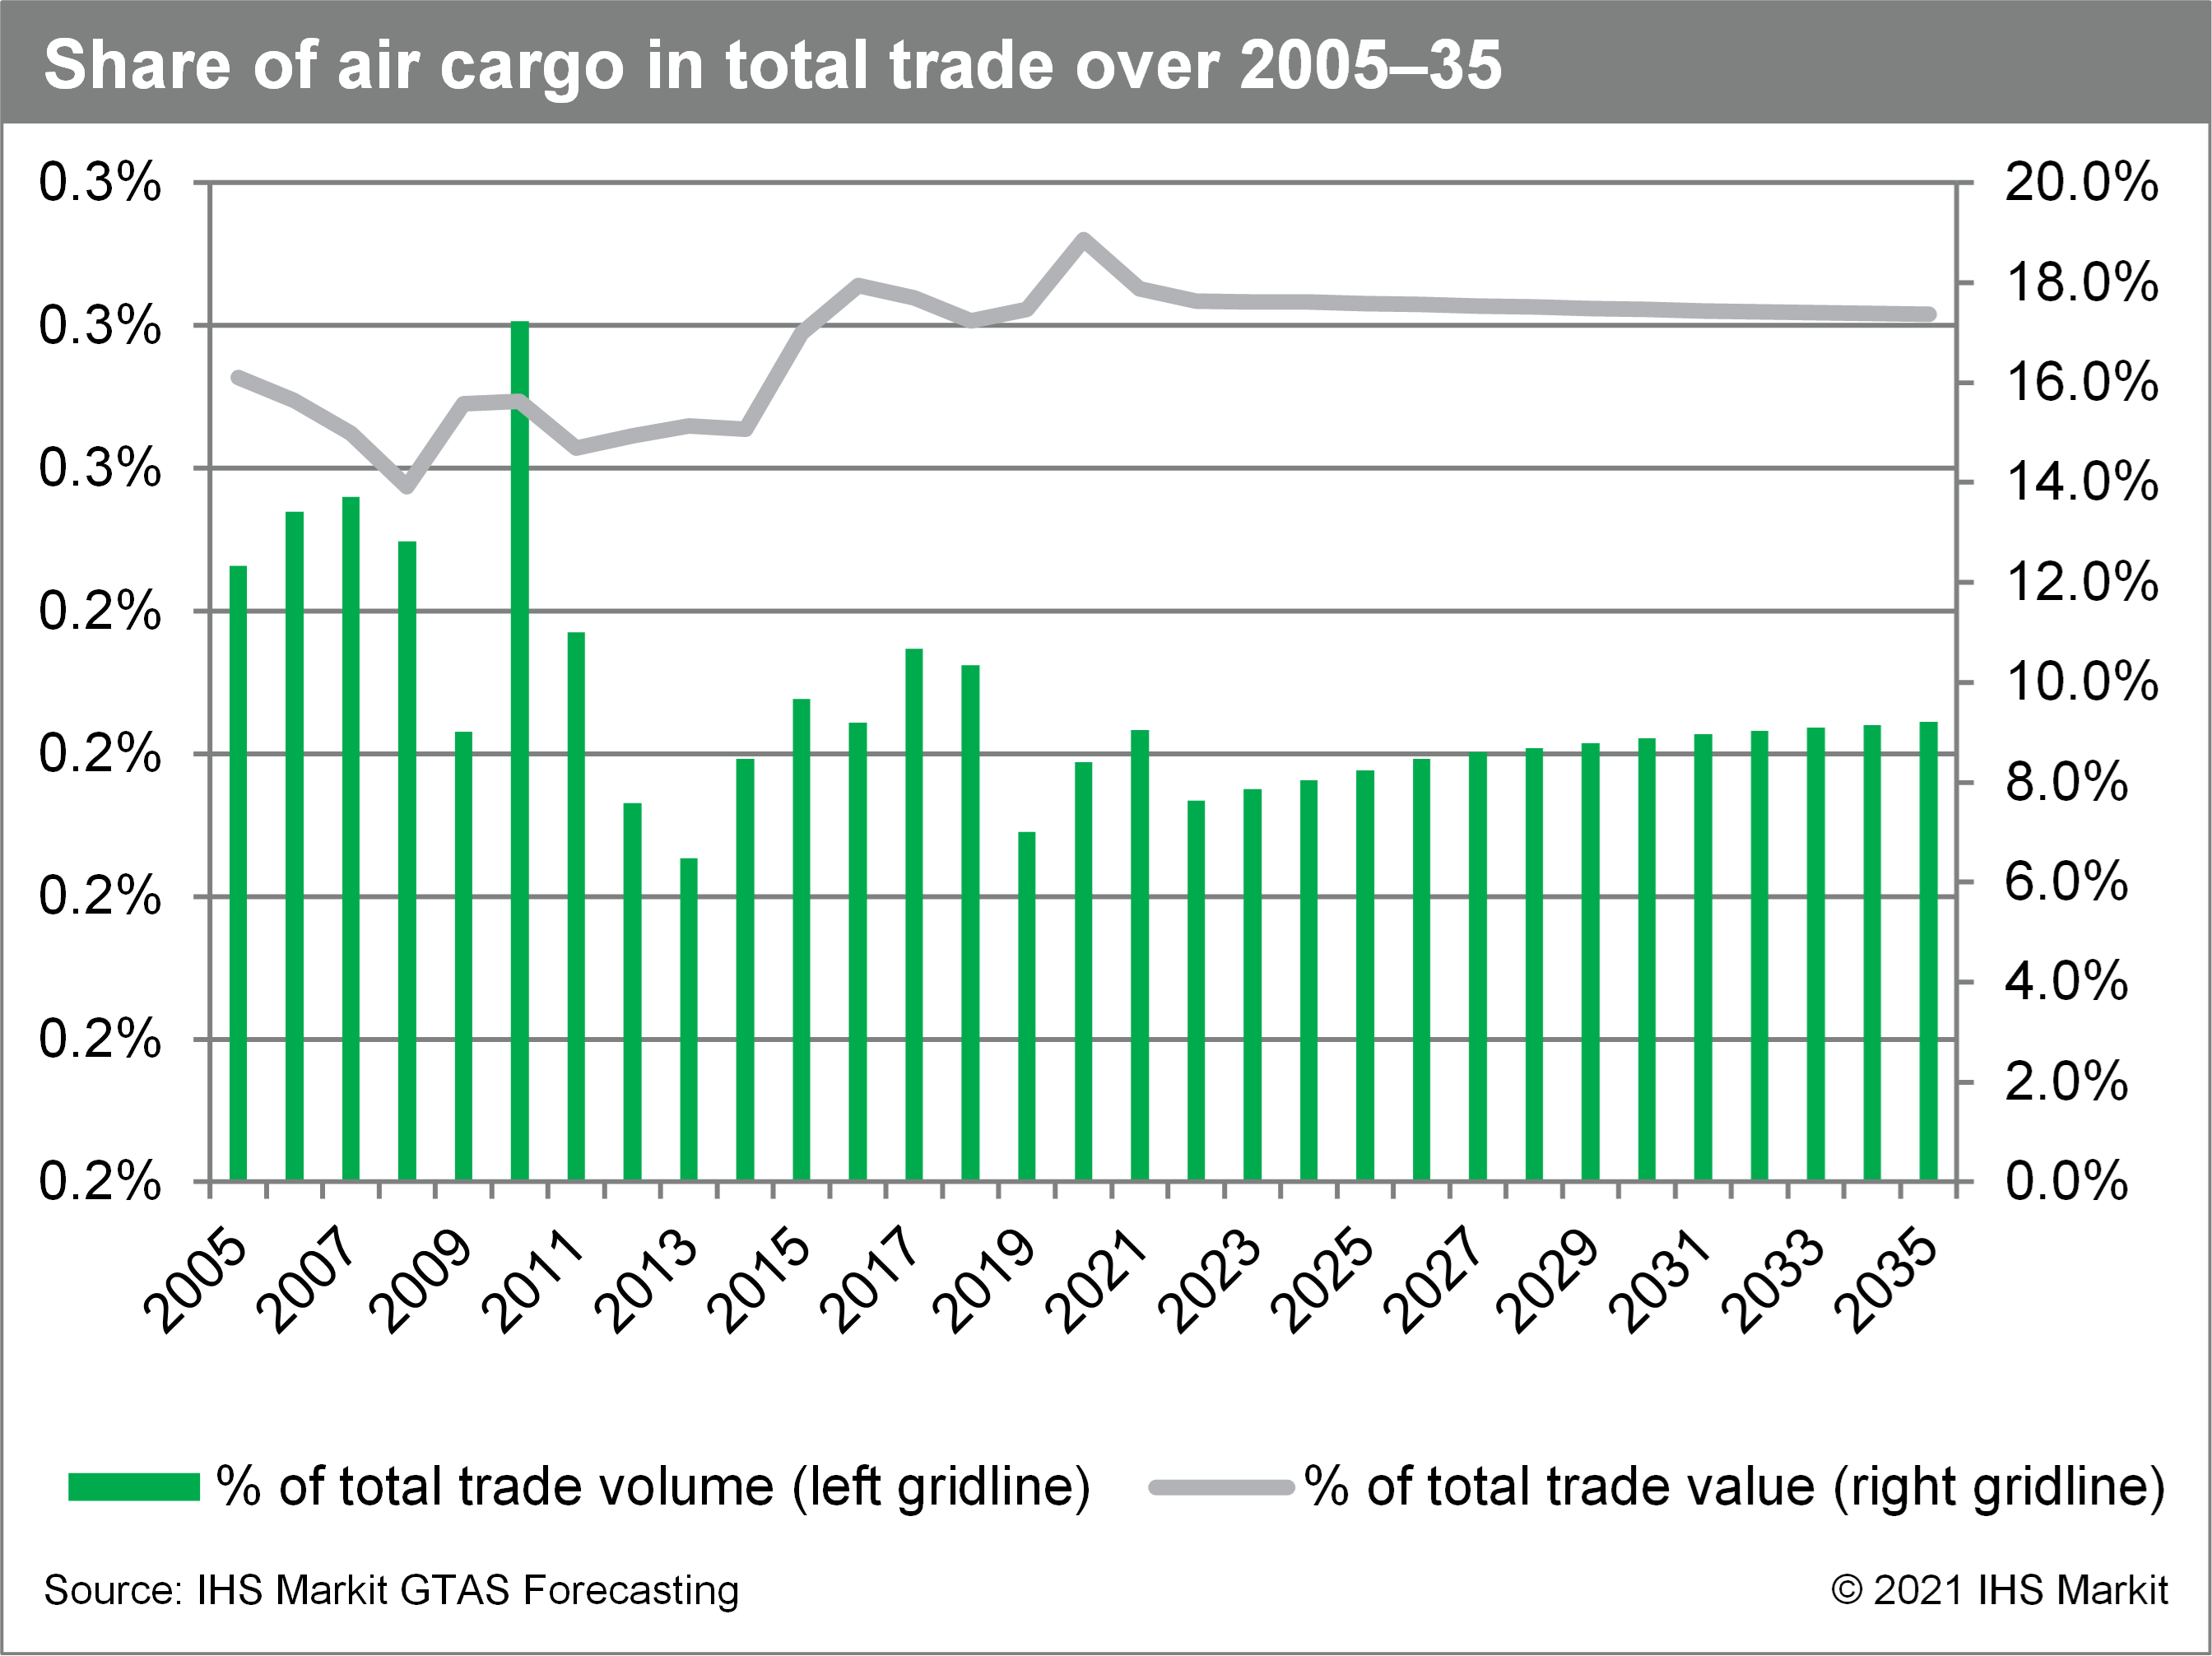
Commercial movement of goods by air started in late 1970's and become immanent part of international trade flows. Over the last decades, both the value and the volume of air cargo increases, with volume growth rate lower than total world trade—CAGR equaled 2.2% over 2005-20 (4.3% for world total trade). Air cargo is expected to grow slightly faster than total trade—about 2.6% versus 2.4% for all-modes trade until 2035. The share of air cargo in world's total trade remains stable and equals 0.2% for volume and 13.9-18.9% for value over 2005-20.


According to IHS Markit's data, in 2020, air cargo amounted to 0.2% of total trade in terms of volume and 18.9% in terms of nominal value. In absolute terms, nearly 33 million metric tons was transported by air, worth over $3.2 billion.
In 2020, air cargo values and volume decreased by 0.03% and 2.1% respectively, relative to 2019. In absolute terms, the decline amounted to $10 billion or 693 thousand metric tons year on year. This can be attributed to COVID-19-related world trade downturn.
We estimate that in 2021, trade by air will increase by 7.7% year on year (y/y) in terms of volume and 6.1% y/y in value terms. Similarly, in 2022 our forecasts show the increase of 0.2% and 0.5% y/y respectively.
Top air cargo routes
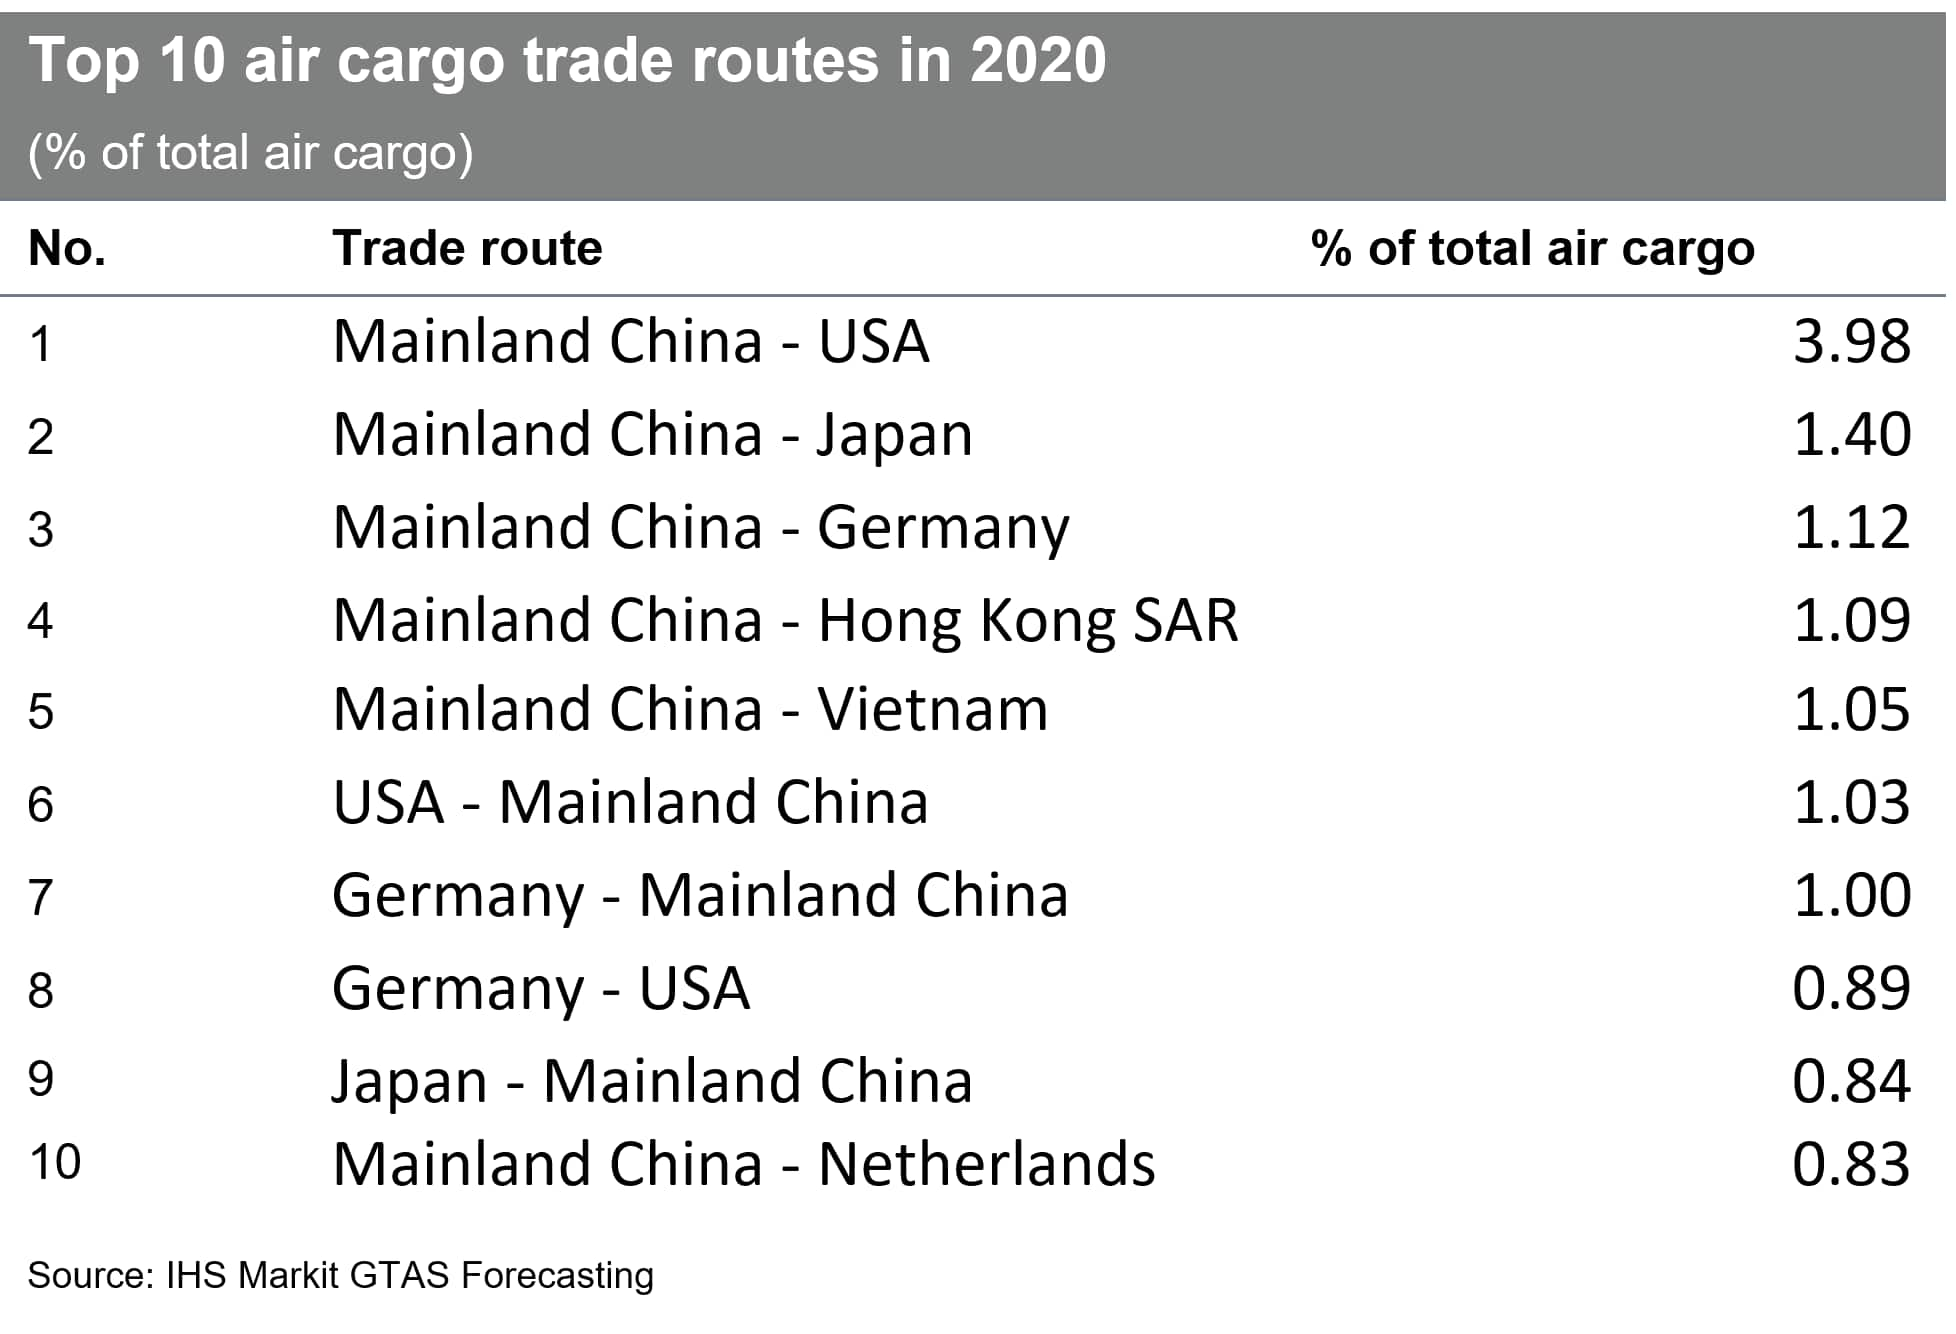
Air cargo trade in 2020 was dominated by the largest economies, primarily by the World's largest economy - mainland China. The most important trade route - between mainland China and the U.S. is responsible for nearly 4% of total air cargo trade and is almost 3 times larger than the second most important trade route - mainland China - Japan.
Among top 10 air cargo trade routes, mainland China is present (as an exporter or an importer) 13 times. Similarly, the U.S. is trade partner in 9 cases. It should be noted however that World air cargo is concentrated to a low extent - trade over top 10 trade routes is responsible for 13% of total air cargo trade.

Top air cargo commodities
Airborne trade in general is dominated by electronic and electric products and its components. The most popular commodity transported by air in 2020 were "Office machines and parts", which amounted to nearly 1.5 million metric tons, around 4.5% of total air trade. The second and the third positions in top commodities ranking was taken by "Onions, garlic, leeks, leguminous vegetables, other vegetables, fresh and chilled" (1.1 million metric ton) and "Telephones, microphones, etc." (nearly 1 million metric ton).

In terms of value, the most important commodities transported by air in 2020 were "Electronic valves, tubes, semiconductors, and other electronic components" ($447,731.4 million), "Precious metals" ($331,350.3), and "Pharmaceutical goods" ($323,460.8 million). Differences between commodities in both tables can be attributed to relatively high variation in the unit value (value per metric ton) of certain commodities transported primarily by air (for example pharmaceuticals).

Airborne trade outlook is a new chapter of GTAS Forecasting's quarterly report "Trends in the World Economy and Trade". For more data and analysis check GTAS Forecasting Analytics @ Connect.
For more insight subscribe to our complimentary commodity analytics newsletter
How can our products help you?