Featured Topics
Featured Products
Events
S&P Global Offerings
Featured Topics
Featured Products
Events
S&P Global Offerings
Featured Topics
Featured Products
Events
S&P Global Offerings
Featured Topics
Featured Products
Events
Financial and Market intelligence
Fundamental & Alternative Datasets
Government & Defense
Banking & Capital Markets
Economy & Finance
Energy Transition & Sustainability
Technology & Innovation
Podcasts & Newsletters
Financial and Market intelligence
Fundamental & Alternative Datasets
Government & Defense
Banking & Capital Markets
Economy & Finance
Energy Transition & Sustainability
Technology & Innovation
Podcasts & Newsletters
23 Aug, 2017 | 15:15
Highlights
The average all-in sustaining cost for primary gold mines remained relatively flat in 2016 at US$879/oz.
We estimate that silver and copper production at primary gold mines will fall by around 7% and 2%, respectively, in 2017.
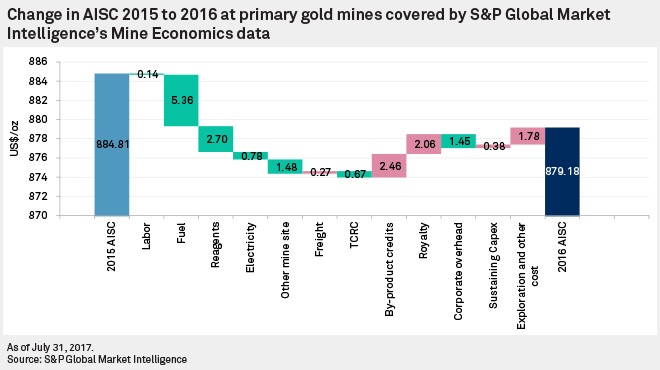
The average all-in sustaining cost, or AISC, in 2016 for primary gold mines covered by S&P Global Market Intelligence's Mine Economics data remained relatively flat from 2015. This was attributable to a drop in fuel, reagents and corporate overhead costs, partially offset by a fall in byproduct credits, increased royalties, and a rise in exploration and other costs. For 2017 as a whole, we expect AISC to again remain flat compared with 2016 due to strengthening local currencies in several major gold producing countries and escalating diesel prices, offset by increased byproduct credits, increased gold production volumes, and by some reductions in capital expenditure and corporate overhead costs.
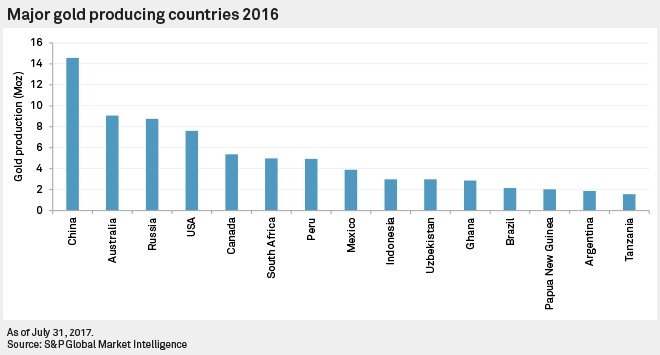
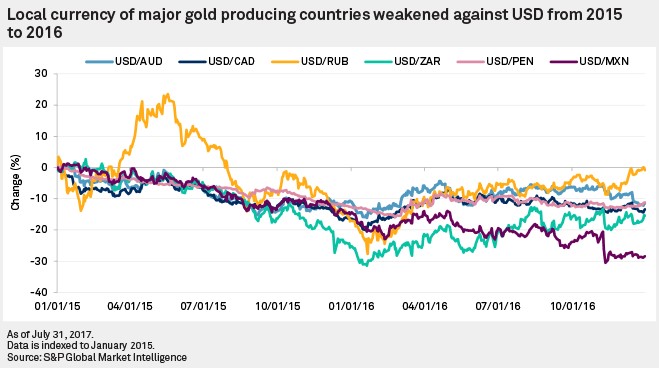
Falling fuel costs exerted the most downward pressure on AISC during 2016 with a drop of 12% year-over-year, equivalent to US$5.36/oz. This decline was primarily attributable to lower diesel prices as a result of the falling oil price over the period; for example, the Brent benchmark fell by 17% year-over-year to an average of US$44/bbl in 2016. Local wholesale diesel prices in major gold-producing countries fell concurrently, with Australia, the U.S., Peru, and Mexico seeing 12%, 13%, 15%, and 12% drops, respectively. Despite the significant drop in wholesale diesel prices, fuel still only accounted for 6% of total mine site costs in 2016, with the balance of the U.S. dollar drop coming largely from weakening local producer currencies. Annual average exchange rates in Canada, Peru, Russia, South Africa, and Mexico fell by 4%, 6%, 9%, 15%, and 18%, respectively, compared with the 2015 average. For some local currencies, such as the South African rand and the Russian ruble, this came despite a strengthening trend throughout the year.
Reagent and corporate overhead costs together provided a further decline of US$4.20/oz. Reagent costs declined by 6% year-over-year on the back of a general decrease in the price of chemicals and reagents at the country level, combined with the previously mentioned foreign exchange environment. Government data from Australia and the U.S. indicate that the cost of chemicals and reagents in local currency fell by 4% and 6%, respectively, in these countries.
Corporate overhead costs fell by 4% last year. This can be attributed to the trimming of corporate expenses, which has been widespread across the mining industry in recent years, as a means of costs management to preserve profit margins amid currently still weak metal prices. In the run up to the peak of the last mining boom in 2012, corporate expenses became bloated, and companies continue to target this as an area where they can cut expenditure.
The overall drop in AISC was partially mitigated by a fall in credits from the main byproduct metals of gold production, and an increase in royalties, exploration, and other sustaining costs.
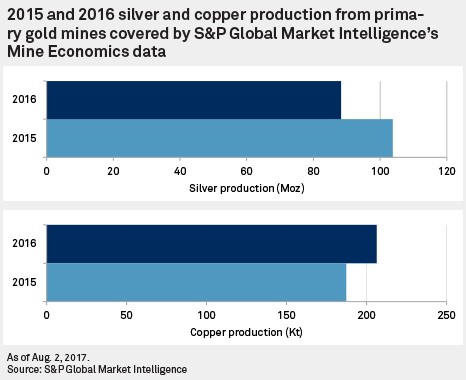
Byproduct credits as a group fell by 4% year-over- year on the back of reduced silver production and declining copper prices. The average silver price increased by 9% year-over-year. This was not, however, enough to offset the decline in silver production volumes from primary gold mines due to a fall in silver grades in processed ores. Such was the case for silver-rich assets like Penasquito, El Penon, and San Dimas. 2016 average silver grades at mines covered by S&P Global Market Intelligence's Mine Economics data fell to 3.9 g/t versus 4.7 g/t in 2015. Conversely, copper production volumes increased by 10% year-over-year, with notable rises from Cadia East, Buzwagi, and Mount Carlton. However, average copper prices fell by 12% year-over-year, offsetting the rise in metal output.
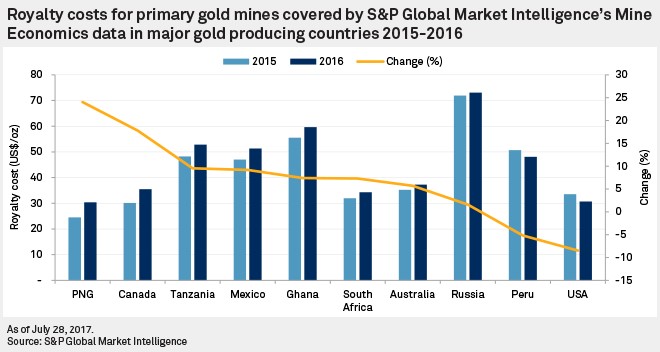
Royalty and production taxes increased by 5%. Of note is that none of the major gold-producing countries increased their royalty or production tax rates during this period. As such, the overall increase is solely a product of the 8% increase in the average gold price year- over-year. Nearly all royalties or production-based taxation are calculated as a percentage of revenue or profits; therefore, as these increase, so do the associated royalties and taxes. However, royalty costs did not increase across all countries, with the average falling in Peru and the U.S. This was a result of the financial performance of operations in these countries, and of the application of private and provincial level royalty and production tax systems.
Sustaining CapEx, exploration and other costs rose by a combined US$2.20/oz year-over-year. Most companies have, in recent years, tightened up their spending on sustaining CapEx and exploration activities as gold prices declined. Sustaining CapEx remained relatively flat compared with 2015, breaking the trend of successive years of falling sustaining CapEx since 2012.
Our 2016 data indicates that exploration and other costs, which includes reclamation, closure, and one-off expenses, increased by 7% year-over-year. Of these, exploration costs declined among most major gold producers with their 2016 budget for mine site exploration falling. Consequently, other costs were the main driver of the increase. This can be attributed to a large number of different costs, but examples include US$39 million spent at Maricunga for its closure and US$20.3 million spent at Tasiast associated with the temporary suspension of its operations during the year.
Labor and electricity provided minor changes. Labor, which accounted for 37% of total mine site costs in 2016, remained relatively flat in U.S. dollar terms, contributing to a minimal decline in total AISC. The cost of labor in local currency increased during the period, as would be expected, but miners' efforts on increasing labor productivity and the foreign exchange environment described earlier combined to mitigate the impact.
Meanwhile, the cost of power generation fell 1% year-over-year. This is due to the drop in diesel and heavy fuel oil resulting in lower on-site generation costs among the population. Additionally, grid prices in several major gold-producing countries decreased in U.S. dollar terms in 2016. Average electricity costs, expressed in U.S. dollars, in Australia, Russia, and the U.S. fell by 5%, 8%, and 15% year-over-year, respectively.
So far in 2017, the year-to-date average of the local currency against the U.S. dollar (until August 7) in Australia, Peru, South Africa, and Russia has already shown a recovery of 2%, 3%, 10%, and 13% respectively, compared with the 2016 full-year averages. Only Mexico has shown further weakness, with a 3% depreciation year-to-date. This would suggest producers will face a headwind from foreign exchange rates on costs thus far. Meanwhile, the average Brent oil price was up by 18% in the period to July 31.
Looking at metal prices, the average for silver to August 7 was unmoved at US$17.15/oz, in line with the 2016 full-year average, while copper reached US$2.63/lb, 19% higher than the 2016 average. We estimate that silver and copper production at primary gold mines will fall by around 7% and 2%, respectively, in 2017. This drop in production volumes will not be enough to offset the increase in metal prices in 2017; therefore, we expect byproduct credits to increase in 2017 compared with 2016, with copper being one of the main drivers.
Taking all these factors into consideration, we see the full-year average AISC for 2017 again as being a relatively flat performance. This is in line with company guidance disclosed by several of the major producers, such as Barrick Gold Corp., Goldcorp Inc., and Kinross Gold Corp. Strengthening local currency at several major gold-producing countries, and escalating oil prices eventually filtering through to producers' wholesale contracts, will act as inflators to AISC. Offsetting this will be higher copper byproduct credits, increased gold production volumes feeding through to unit costs and some easing on CapEx and corporate overheads.
Find out more about our mining industry research and analysis.
