Featured Topics
Featured Products
Events
S&P Global Offerings
Featured Topics
Featured Products
Events
S&P Global Offerings
Featured Topics
Featured Products
Events
S&P Global Offerings
Featured Topics
Featured Products
Events
Financial and Market intelligence
Fundamental & Alternative Datasets
Government & Defense
Banking & Capital Markets
Economy & Finance
Energy Transition & Sustainability
Technology & Innovation
Podcasts & Newsletters
Financial and Market intelligence
Fundamental & Alternative Datasets
Government & Defense
Banking & Capital Markets
Economy & Finance
Energy Transition & Sustainability
Technology & Innovation
Podcasts & Newsletters
ECONOMICS COMMENTARY — Jun 08, 2022
The latest PMI data compiled for JPMorgan by S&P Global revealed an unwelcome mix of sluggish global economic growth and soaring business costs in May. Although global supply chains showed tentative signs of healing, taking some pressure off raw material cost inflation, May saw service sector cost inflation hit a new all-time high as companies struggled amid tight labour markets and energy prices surged higher. Worryingly, the steepest rise of all was recorded for food manufacturing, where the rate of cost inflation was at an unprecedented high to suggest that the cost-of-living crisis is showing no signs of abating yet.
Developments in China and Ukraine meanwhile added uncertainty to the inflation outlook, albeit with risks tilted towards persistent elevated inflation.
The following survey data reflect information provided by panels of over 30,000 companies in 45 countries and tell the story of the current inflation picture in a dozen key charts.
Chart 1: Global PMI output, prices and supply delays
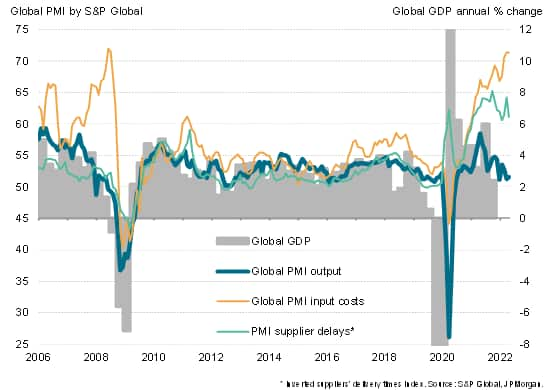
Although global output growth picked up slightly in May, it remained at one of the weakest levels seen so far in the pandemic recovery period, according to S&P Global's PMI business survey data. At the same time, the survey's gauge of input cost inflation hit the second highest since the commodity price surge of 2008-09, easing only marginally from April's peak.
Chart 2: Input costs in major developed economies
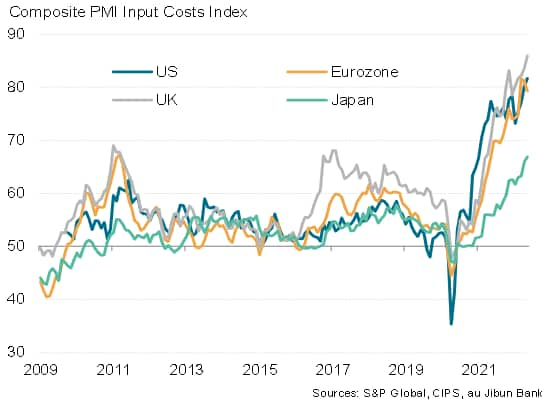
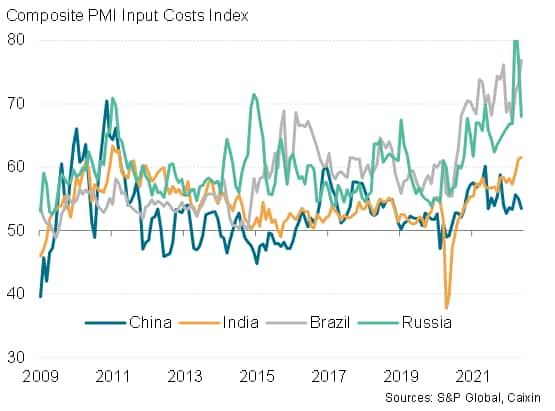
While the UK and US are reporting the steepest cost increases of the world's major economies, with new record rates of inflation witnessed in May, costs are also rising at unprecedented rates in Japan and Brazil and at near-record rates in the eurozone, India and Russia, albeit with the eurozone and Russia reporting easing in their rates of inflation. Meanwhile price pressures remained relatively subdued in China, linked to low demand arising from lockdowns and reports of government price interventions.
Chart 3: Input costs in major emerging markets
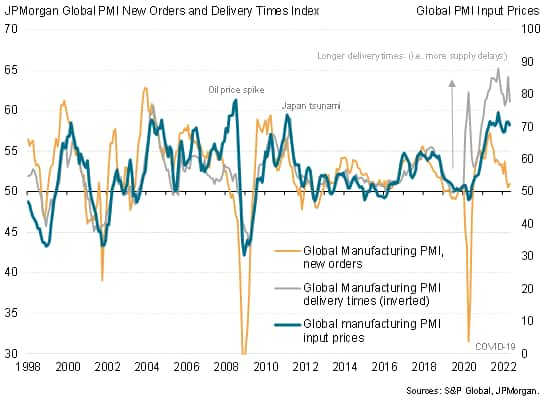
The path of inflation by sector has been notable over the pandemic. Price rises were initially led by manufacturing, with surging industrial material prices stemming from a combination of supply bottlenecks and buoyant demand in 2020 and much of 2021. In recent months, manufacturing input cost inflation remained elevated, but has shown signs of levelling off, and even easing slightly, due to a peaking in the number of supply delays and a commensurate cooling of demand.
Chart 4: Manufacturing prices, supply and demand
Manufacturing input cost inflation remained highest in Europe and the US (see chart 5), where supply chains delays also remained the most widely reported (see chart 6). However, there has been a notable reduction in the number of supply delays reported in recent months in the US, eurozone and UK compared to peaks seen in 2021, which helped bring raw material inflation rates down from 2021 peaks. It is a different situation in Japan, however, and many other Asian economies, where supply chain disruptions emanating out of China's recent lockdowns have caused unprecedented supply delays in recent months and a further acceleration of input cost inflation.
Chart 5: Manufacturing input costs
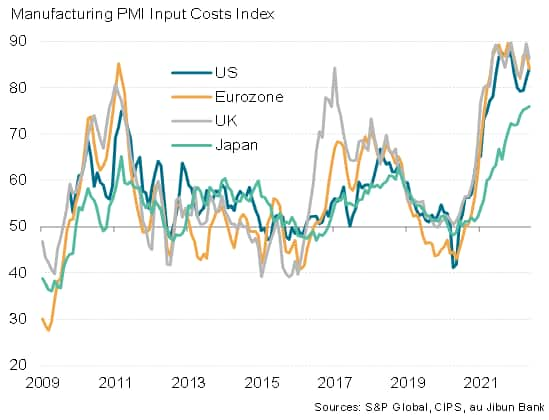
Chart 6: Manufacturing supply chain delays
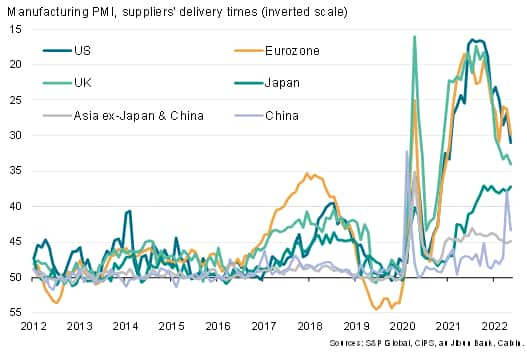
Chart 7: Energy prices in manufacturing
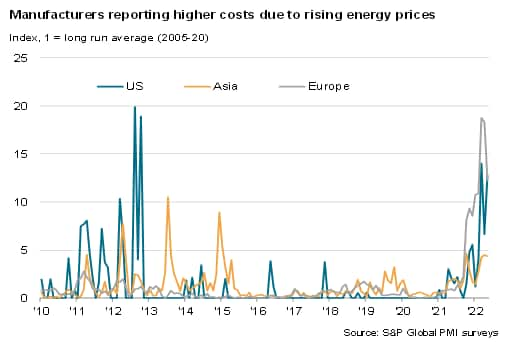
While supply chains have shown signs of taking some heat out of factory input costs in recent months, energy prices have added to cost pressures, notably in Europe and the US, the latter feeling the heat more than Europe in May (see chart 7).
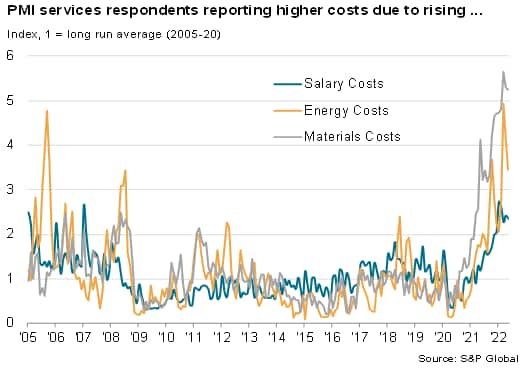
Energy prices are meanwhile also causing major cost concerns in the service sector, which reported upward pressures from material prices and staff costs. All three factors have driven service sector costs up by degrees rarely seen since data were first available in 2005 (see chart 8).
Chart 8: Service sector cost drivers
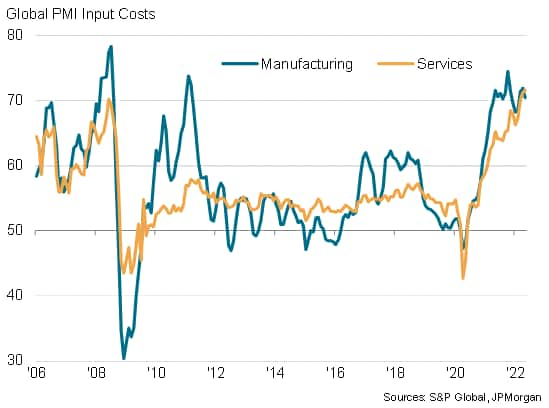
As a consequence, May saw service sector inflation measured globally exceed that of manufacturing for the first time in almost two years, with services costs rising at the steepest rate ever recorded by the PMI surveys (chart 9).
Chart 9: Global input price inflation by sector
Of the major developed economies, the UK reported the steepest rise in service sector costs as the rate of inflation hit a new all-time high. This was followed by the US, which also saw a record increase. Costs pressures eased in the eurozone but merely from April's record high, while Japan also saw a more muted but still unprecedented increase.
Chart 10: Services input price inflation
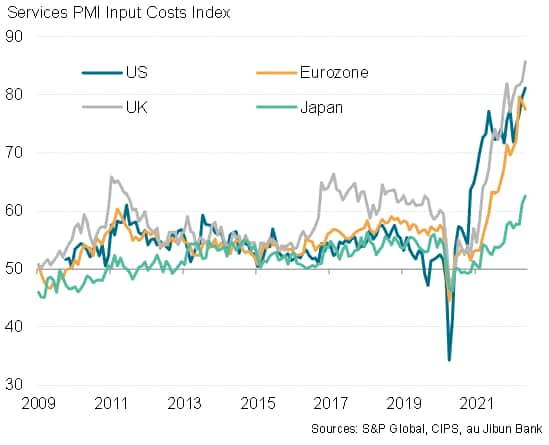
Chart 11: Global input price inflation by sector
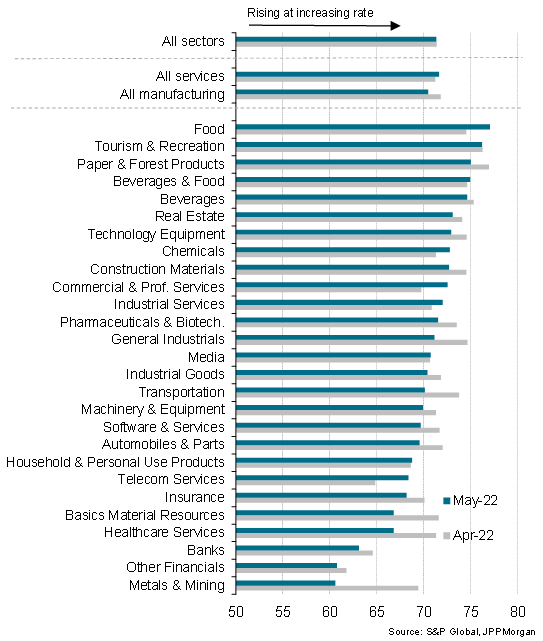
Looking in more detail at global cost pressures by sector, the highest rate of inflation was recorded by food manufacturers, where the rate of increase hit the highest since comparable data were first available in 2009.
The second highest rate of increase was recorded in the tourism and recreation sector, with companies struggling to expand to meet demand and have reported surging labour, fuel and other costs -including food inputs.
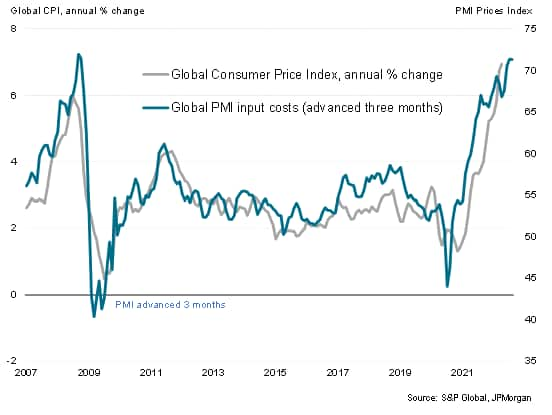
The survey data therefore indicated that global inflation is likely to accelerate in annual terms in May and June, though potentially cooling slightly thereafter, albeit remaining very elevated - above 6% - in the second half of 2022.
Chart 12: Global PMI input and output price inflation
Despite supply chain pressures having somewhat alleviated, taking some of the heat out of raw material prices, service sector cost inflation is accelerating as firms struggle to hire or retain staff while soaring energy costs add to price pressures.
The key unknowns as we look to the future will be the war in Ukraine and the COVID-19 situation in China. With any resolution to the war looking unlikely in the near term, energy prices look set to remain high and food price inflation could worsen as supply from Ukraine continues to be disrupted. In mainland China, lockdown restrictions now appear to be easing, which should help restore some supply chain capacity to the global manufacturing network, and therefore ease some global supply chain associated price pressures. However, any sudden upturn of economic growth in China will likely add to commodity price inflation, potentially offsetting some of the beneficial supply chain impact.
In short, risks seem tilted toward the adverse global supply situation, keeping pressure on prices for some time to come, though uncertainties are unusually high.
Sign up to receive updated commentary in your inbox here.
Chris Williamson, Chief Business Economist, S&P Global Market Intelligence
Tel: +44 207 260 2329
chris.williamson@spglobal.com
© 2022, IHS Markit Inc. All rights reserved. Reproduction in whole or in part without permission is prohibited.
Purchasing Managers' Index™ (PMI™) data are compiled by IHS Markit for more than 40 economies worldwide. The monthly data are derived from surveys of senior executives at private sector companies, and are available only via subscription. The PMI dataset features a headline number, which indicates the overall health of an economy, and sub-indices, which provide insights into other key economic drivers such as GDP, inflation, exports, capacity utilization, employment and inventories. The PMI data are used by financial and corporate professionals to better understand where economies and markets are headed, and to uncover opportunities.
This article was published by S&P Global Market Intelligence and not by S&P Global Ratings, which is a separately managed division of S&P Global.
