Featured Topics
Featured Products
Events
S&P Global Offerings
Featured Topics
Featured Products
Events
S&P Global Offerings
Featured Topics
Featured Products
Events
S&P Global Offerings
Featured Topics
Featured Products
Events
Financial and Market intelligence
Fundamental & Alternative Datasets
Government & Defense
Banking & Capital Markets
Economy & Finance
Energy Transition & Sustainability
Technology & Innovation
Podcasts & Newsletters
Financial and Market intelligence
Fundamental & Alternative Datasets
Government & Defense
Banking & Capital Markets
Economy & Finance
Energy Transition & Sustainability
Technology & Innovation
Podcasts & Newsletters
ECONOMICS COMMENTARY — Mar 02, 2022
Worldwide manufacturing growth picked up in February after being subdued to a one-and-a-half year low in January due to the Omicron wave. However, the overall rate of expansion continued to be constrained, limited by a combination of supply chain delays and worker shortages. Prices rose at an increased rate - one of the highest in a decade - as a result.
Although these supply constraints showed some signs of easing, they will likely be exacerbated again by the Ukraine war, as will the upward pressure on prices.
The JPMorgan Global Manufacturing PMI rose from a 15-month low of 53.2 in January to 53.6 in February in a sign that the global economy continued to show encouraging resilience in the face of the Omicron wave of the COVID-19 pandemic.
Global manufacturing PMI and its five components
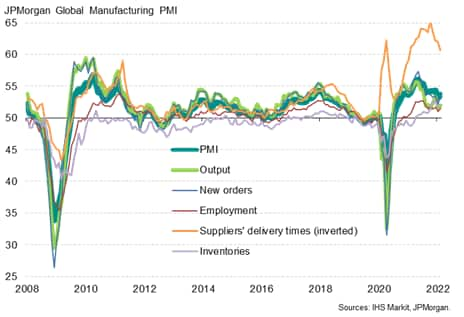
However, it is the detail behind the PMI, which is comprised of five sub-indices, which provides the important details of what is really happening in the manufacturing economy at the moment in terms of demand, supply constraints and production. Other PMI survey indices relating to costs and selling prices meanwhile provide further guidance on inflation trends.
These indices are explored further in the following ten key charts:
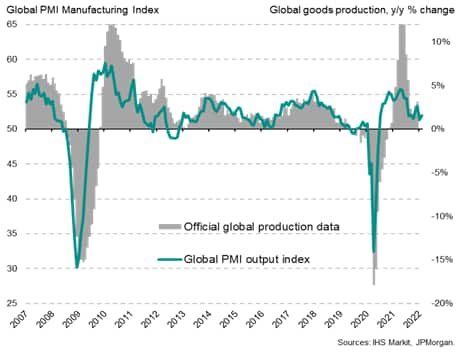
While the headline PMI registered 53.6 in February, the survey's output index merely rose from 51.3 to 51.9, which is the fourth weakest since the initial pandemic recovery started in July 2020 and is significantly weaker than the survey's pre-pandemic average of 52.8, thereby signalling below-trend growth. The latest reading is indicative of global manufacturing production growing at a modest annual rate of just under 2%.
Global manufacturing PMI, output index
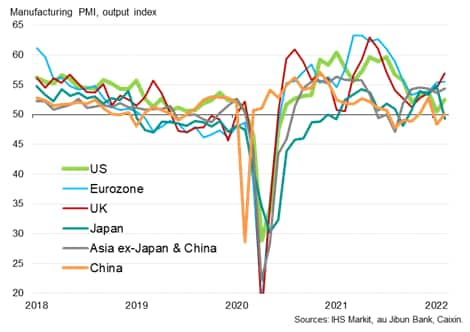
Production growth was led by a recovering Europe, with output growth accelerating to a seven-month high in the UK and a five-month high in the eurozone. It was also reassuring to see output growth accelerate in Asia excluding Japan and China, suggesting the region has so far been affected by the Omicron variant to a considerably lesser degree than the Delta wave. Similarly, production in China stabilised amid improving demand after being hit by Omicron in January. However, production fell in Japan as COVID-19 restrictions were raised, and output growth in the US remained lacklustre.
Production upturn led by Europe
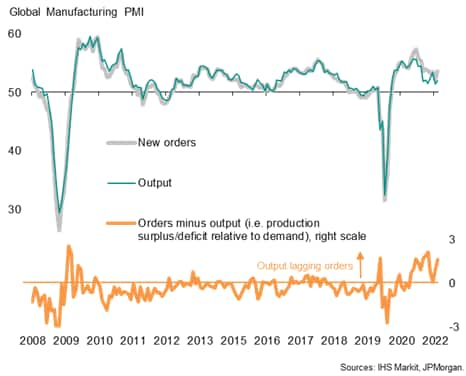
The relative weakness of February's global output growth by historical standards contrasted with a more robust expansion of order books recorded during the month. New orders rose to the greatest extent since last October, with the latest new orders index reading of 53.5 running above the pre-pandemic long-run average of 52.6 to signal an above-trend rate of demand growth.
Output growth has in fact now lagged inflows of new orders continually since March of last year, hinting at persistent production constraints which intensified in February.
Global manufacturing PMI, output and new orders
By far the greatest shortfall of production relative to new orders was seen in the US, followed by Australia, Germany, Ireland, South Korea and Taiwan.
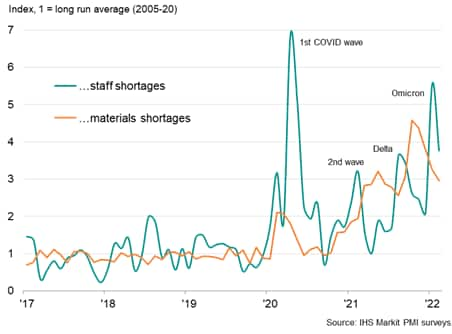
In anecdotal reporting provided in the questionnaires completed by PMI survey respondents, production was again indicated to have been constrained by a combination of raw material and staff shortages, the latter in fact more widely reported than material shortages in recent months. Staffing issues have become increasingly problematic since the Omicron variant, with employees often reported ill or self-isolating as a result of the more contagious variant.
Although some easing in the incidence of staff shortages was recorded in February, the degree to which output was constrained on average remained elevated by historical standards of the pandemic, exceeded only by that seen in the initial COVID-19 wave.
Likewise, reports of output being constrained by raw materials remained high by historical standards, albeit so far running below that seen in the aftermath of the Delta wave, thanks in part to the resilience of production across much of Asia.
Global manufacturers reporting lower output due to …
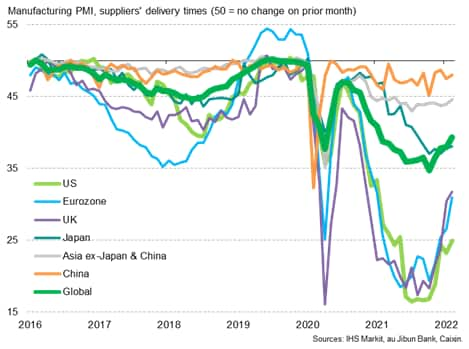
The reduction in the number of companies reporting production to have been constrained by a lack of raw materials reflected a commensurate drop in the reporting of supplier delivery delays. Measured globally, supplier lead times continued to lengthen in February but with the incidence of delays running at the lowest since the start of last year. Delivery delays eased most notably in Europe and to a lesser extent in the US, but in all cases remain elevated by historical standards.
Supplier delivery times
Concerns over raw material availability was a key driver of another near-record rise in manufacturers' inventories of inputs in February. The past five months have seen the greatest period of inventory building recorded over the global PMI's 25-year history, reflected as a spike in the number of companies reporting that inventories were being increased due to the need to build safety stocks.
Global raw material inventories
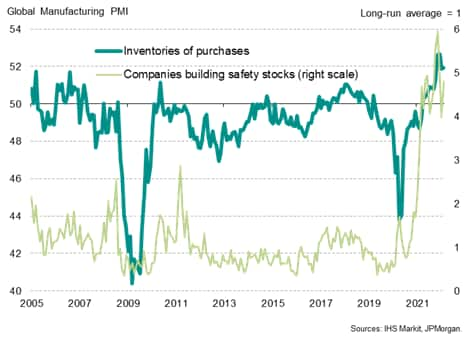
Such widespread safety stock building has further exacerbated the demand-supply imbalance in the global manufacturing economy.
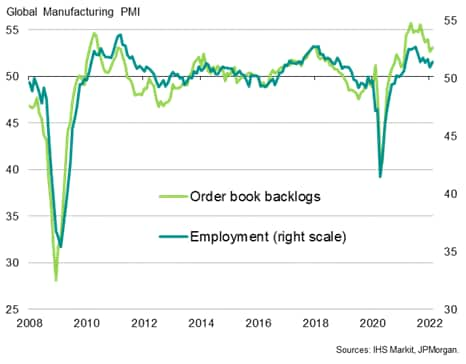
Although employment rose again in February, companies often reported that job gains were limited by a lack of available candidates to fill positions and staff leavers. The lack of personnel was also a principal cause of rising backlogs of work which, although rising at a slower rate than seen throughout much of 2021, continued to accumulate at rate rarely exceeded over the survey's history.
Global manufacturing employment
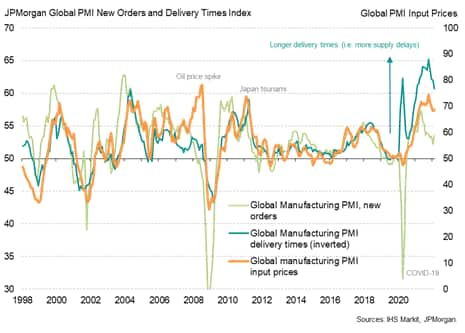
With demand running ahead of supply amid ongoing production constraints, input costs continued to rise in February at one of the sharpest rates seen over the past decade, the rate of inflation picking up slightly though remaining below last October's peak.
In addition to a sustained sellers' market persisting for many key raw materials and manufactured inputs such as semiconductors, costs are also being pushed up by rising energy costs.
Manufacturing input prices, supply and demand
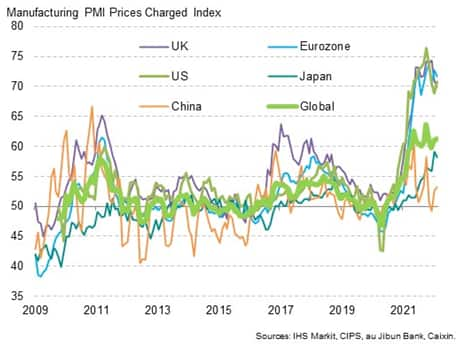
The sustained upward pressure on raw material input costs, combined with upward pressure on wages as firms sought to attract and retain workers, led for a renewed upturn in global factory selling price inflation. Prices for goods leaving the factory gate rose in February at the fastest rate since November, registering the fourth-largest monthly increase recorded since comparable data were available in 2009.
Especially strong increases were seen in the US and Europe, although a new high was printed in Asia excluding Japan and China. Japan saw the rate of increase cool only slightly from January's all-time high. While selling price inflation remained relatively muted in China, reflecting weaker input costs pressures amid government interventions in commodity markets, the rate of increase nevertheless likewise accelerated.
Factory gate price inflation
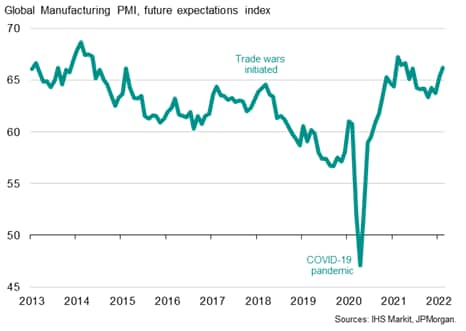
A positive sign from the February surveys was an improvement in business expectations for the year ahead to the highest since last April. Companies were optimistic that the worst of the economic impact of the pandemic was behind them, and that supply chains would continue to gradually improve, job markets would recover and that production would increase.
Future output expectations
However, it should be noted that the February PMI data were collected prior to the Russian invasion of Ukraine. Few companies had reported that the Ukraine tension affected their business confidence in the February survey results, which will inevitably change in the March survey.
There will be a number of ways in which the Ukraine crisis is likely to affect the manufacturing economy, signs for which will be assessed in the upcoming March PMI data:
Our commentary highlighting the impact of the war and the ongoing pandemic as evidenced by the business surveys will be published free-to-read. Sign up to receive updated commentary in your inbox here.
Chris Williamson, Chief Business Economist, IHS Markit now a part of S&P Global
Tel: +44 779 5555 061
chris.williamson@spglobal.com
© 2022, IHS Markit Inc. All rights reserved. Reproduction in whole or in part without permission is prohibited.
Purchasing Managers' Index™ (PMI™) data are compiled by IHS Markit for more than 40 economies worldwide. The monthly data are derived from surveys of senior executives at private sector companies, and are available only via subscription. The PMI dataset features a headline number, which indicates the overall health of an economy, and sub-indices, which provide insights into other key economic drivers such as GDP, inflation, exports, capacity utilization, employment and inventories. The PMI data are used by financial and corporate professionals to better understand where economies and markets are headed, and to uncover opportunities.
This article was published by S&P Global Market Intelligence and not by S&P Global Ratings, which is a separately managed division of S&P Global.
