Featured Topics
Featured Products
Events
S&P Global Offerings
Featured Topics
Featured Products
Events
S&P Global Offerings
Featured Topics
Featured Products
Events
S&P Global Offerings
Featured Topics
Featured Products
Events
Financial and Market intelligence
Fundamental & Alternative Datasets
Government & Defense
Banking & Capital Markets
Economy & Finance
Energy Transition & Sustainability
Technology & Innovation
Podcasts & Newsletters
Financial and Market intelligence
Fundamental & Alternative Datasets
Government & Defense
Banking & Capital Markets
Economy & Finance
Energy Transition & Sustainability
Technology & Innovation
Podcasts & Newsletters
BLOG — Apr 29, 2021
This column is based on Eurostat's COMEXT database, IATA industry reports as well as data from IHS Markit Maritime & Trade GTA Forecasting, and other resources offered by IHS Markit.
Eurostat's COMEXT data will be integrated with the IHS Markit GTA Forecasting database by the end of May 2021 to better split the global trade volumes between different modes of transport and to increase the number of modes reported for EU-trade to accommodate rail and road transport. The new research article based on the upgraded GTA Forecasting dataset will be published in early June.
Key findings
Introduction
2020 proved to be one of the most difficult years in the history of aviation and simultaneously one of the worst for the global economy due to the biggest black-swan in a century, the COVD-19 pandemic.
COVID-19, a simultaneous supply and demand shock affected global value chains, global trade and passenger flows due to introduced lockdowns, forced production stoppages, restricted travel as well overall lower consumer confidence.
The pandemic is not over, however, the unprecedented speed of development of successful vaccines, progress with mass vaccination schemes in particular in the advanced nations, can spur some optimism that within a year or two years, we will be able globally to control the situation. The crises have proven the vulnerability of the global economy and that different parts of the world were affected the different degrees.
Airborne trade plays a significantly more important role in servicing global trade flows in terms of nominal values than volumes - mostly due to the structure of products being transported. In the present article, we will focus on volumes and the extra-EU trade flows (due to data availability).
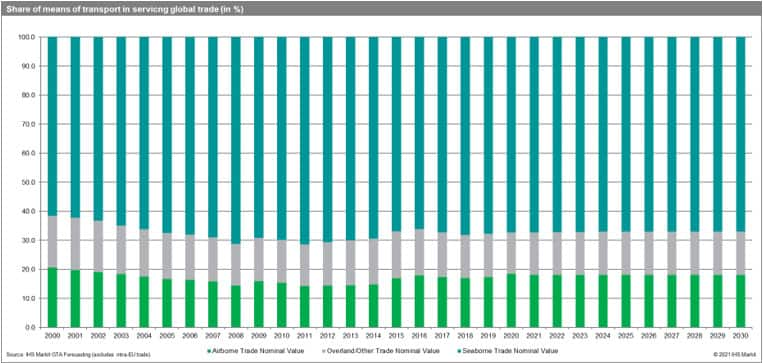
IATA - a momentous fall in RPKs & CTKs
According to IATA reports, revenue passenger-kilometers (RPKs) fell drastically by a staggering 66% year-on-year - eight times faster than during the 12 months following the 9/11 attacks, which was considered to be the most severe aviation crisis before 2020. One of the regions most affected was Europe. In 2020, the industry-wide passenger load factor (PLF) was on average 17.8 percentage points lower year-on-year and stood at 64.8%.
The expected rebound was adversely impacted by the third wave of COVID-19 cases, new regional/nationwide lockdowns, and increased travel restrictions. International air markets have been impacted to a greater extent than domestic routes since many countries closed their borders or imposed travel regulations to limit the virus spread.
Air cargo in 2020 was affected more than global trade volumes (CTKs fell by 10.6% yoy with global trade volume falling by 5.3% but significantly less than passenger flows). Air cargo volumes improved significantly in Q3 and Q4 2020, from the lowest point in Q2, with global CTKs reported by IATA down only 0.5% year-on-year in December. Nonetheless, 2020 brought the largest decline in CTKs from 1990.
While an inventory restocking cycle has started in the latter part of the year, benefiting air cargo, capacity constraints are still hampering a fuller recovery.
IATA reports that industry-wide available cargo tonne-kilometers (ACTKs) down 23.3% year-on-year in 2020, on the other hand, cargo load factors, yields, and revenues rose to record-high levels, providing support to airlines and some long-haul passenger services adversely affected by a collapse in passenger revenues.
International CTKs declined in all the main regions except Africa (up 1.9% year-on-year) in 2020. It is worth stressing that Europe is responsible for 23.6% of global CTKs. IATA reports that CTKs in Europe went down by 16.0% with available cargo tonne-kilometers (ACTKs) in Europe decreased by -27.1%. Freight load factor (CLF, % of ACTKs used) went up by 7.9% to 59.7%.
The role of air cargo in extra-EU27 trade
To illustrate the impact of COVID-19 on air cargo flows in Europe we have utilized the EU Eurostat's extra-EU trade since 2000 by mode of transport, by HS database.
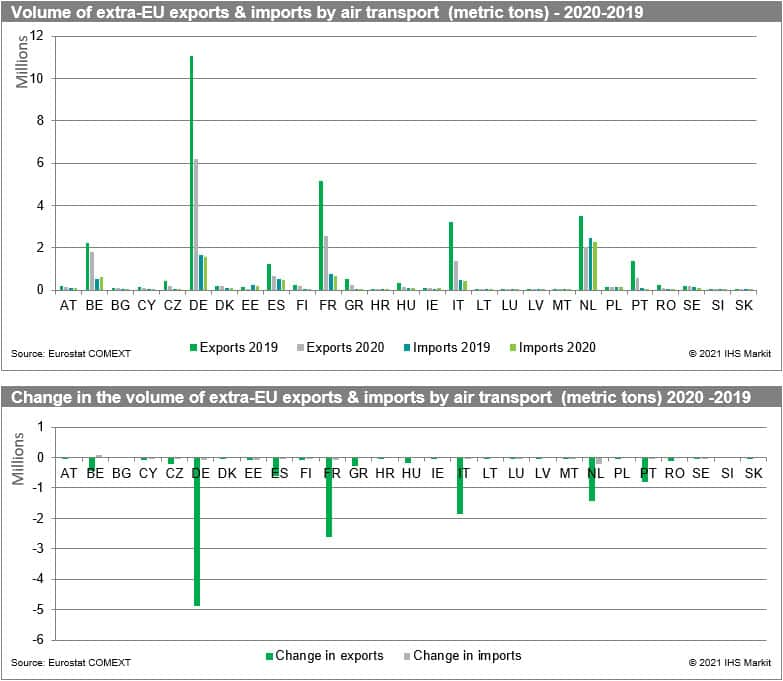
The role of air cargo in servicing extra-EU trade in terms of volumes is the largest in the case of Germany (6.20 million metric tons), France (2.55 million metric tons) and the Netherlands (2.05 million metric tons). It exceeded one million metric tons in Belgium (1.80) and Italy (1.39) and was above 0.50 million metric tons for Portugal (0.65) and Spain (0.57). In imports, the volumes were the highest for the Netherlands (2.27 million metric tons), Germany (1.55 million metric tons), and France (0.67 million metric tons).
The workload is significantly larger in servicing extra-EU exports than imports - 17.25 million metric tons in exports and 7.31 million metric tons in imports.
The fall in the volume of extra-EU by air cargo in 2020 (relative to 2019) was the highest in the case of Germany (-4.87 million metric tons, - 44% yoy), France (-2.60 million metric tons, -50.5%), Italy (-1.85 million metric tons, -57.1%) and the Netherlands (-1.43 million metric tons, -41.2%). The volume of exports by air transport increased for Bulgaria only (+36.5%). For the EU-27 as a whole, it went down yoy by -13.7 million metric tons (-44.3%).
The fall in imports was limited and was significant only in the case of the Netherlands (-0.21 million metric tons, -8.5% yoy). For the EU-27 as a whole, it went down yoy by only -0.43 million metric tons (-5.5%). The volume of imports by air cargo grew in 2020 yoy in 19 out of 27 states.
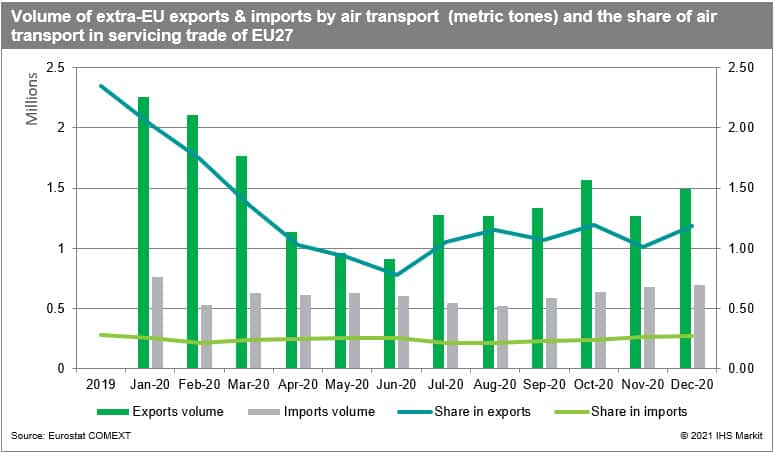
The more granular analysis using monthly-reported data shows clearly that COVID-19 affected EU exports by air to a more significant extent than imports.
It could be due to the nature of the crisis - a simultaneous shock to global supply (production stoppages, lockdowns, extra safety procedures, disruption to global value chains) and demand (weaker demand for products & services, lower consumer confidence).
The share of air cargo in servicing extra-EU trade went down from the average of 2.35% in 2019 to 1.21% in 2020 (in imports it dropped from 0.28% in 2019 to 0.24% in 2020). The volume and the share of air cargo in exports were dropping consistently from January to June 2020 (the lowest point, 0.78% share) and then rebounded by stated significantly below of 2019 level and did not reach the levels from Q1 2020. The lowest point in imports was reached in August and then rebounded.
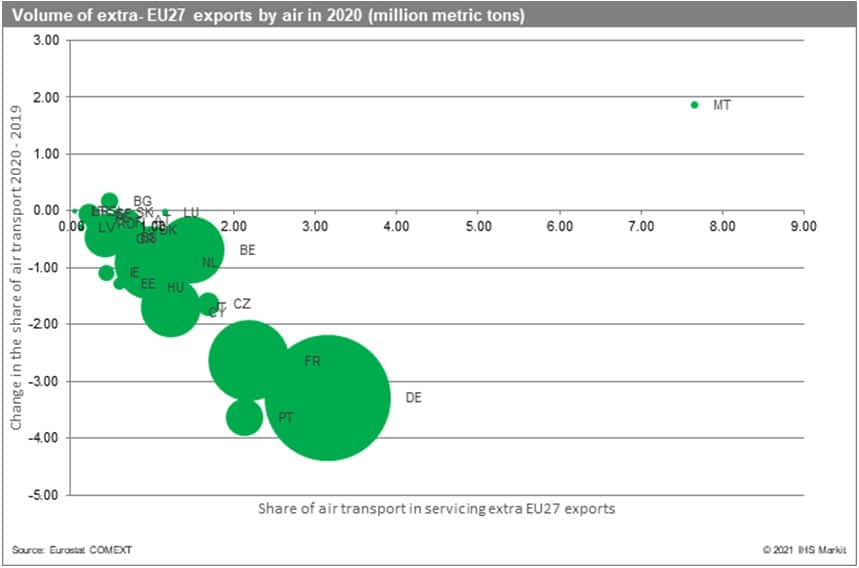
Malta is the EU-27 Member State with the highest share of extra-EU exports volume serviced by air cargo (7.65%), followed by Germany (3.15%) and France (2.18%) and Portugal (2.13%). To put everything in the correct context please consider the actual volume of exports. In 2020 the share went up only in the case of Malta & Bulgaria.
The share of air cargo in servicing EU-27's exports varies significantly by destination. The share exceeds 5% in the case of Anguilla (37.6%), Northern Mariana Islands (14.1%), Bhutan (12.5%), Afghanistan (8.0%), Tokelau (7.7%) and Macao (6.3%). It is also high for Cocos (Keeling) Islands (4.6%), Maldives (3.5%), Hong Kong (3.4%), Botswana (2.9%), Kiribati (2.5%), Zimbabwe, Zambia and Laos (2.3% each) and South Korea (2.2%).
The share generally increases in distance from Europe, but to a large extent depends on the geographical features of the destination and product structure of the trade flow.

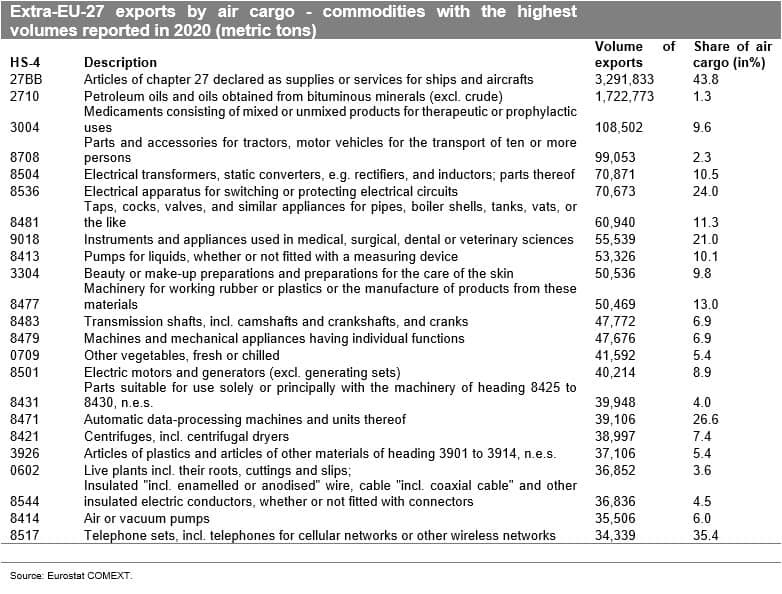
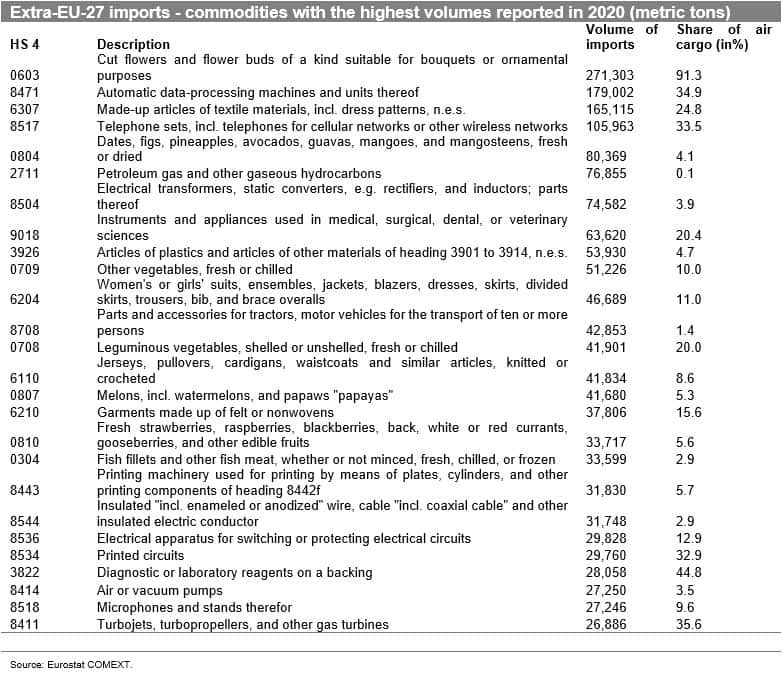
The product structure of extra-EU-27 exports and import volumes in 2020 varies significantly with the highest volume of exports being the supplies for ships and aircraft and cut flowers and flower buds in imports. The commodities transported include a variety of goods from various sectors including fresh plants, vegetables, and fruits, specialized high-tech or medium-high technology goods, high-value-added goods and materials.
The highest share of air cargo in imports to EU-27 (exceeding 75%) includes confidential trade of chapter 43 (furskins), diamonds, cut flowers, and flower buds, chemical elements and compounds doped for use in electronics, machines for extruding, drawing, texturing or cutting man-made textile materials & cinematographic films.
In exports outside of EU-27 in turn the highest shares are observed in the case of books (confidential trade of chapter 49), chemical elements and compounds doped for use in electronics, revolvers and pistols, electron microscopes, proton microscopes and diffraction apparatus, liquid crystal devices and lasers as well as optical microscopes, incl. those for photomicrography, cinephotomicrography, or microprojection.
For more details about GTA Forecasting please visit the product page.
Subscribe to our monthly newsletter and stay up-to-date with our latest analytics
How can our products help you?