Featured Topics
Featured Products
Events
S&P Global Offerings
Featured Topics
Featured Products
Events
S&P Global Offerings
Featured Topics
Featured Products
Events
S&P Global Offerings
Featured Topics
Featured Products
Events
Financial and Market intelligence
Fundamental & Alternative Datasets
Government & Defense
Banking & Capital Markets
Economy & Finance
Energy Transition & Sustainability
Technology & Innovation
Podcasts & Newsletters
Financial and Market intelligence
Fundamental & Alternative Datasets
Government & Defense
Banking & Capital Markets
Economy & Finance
Energy Transition & Sustainability
Technology & Innovation
Podcasts & Newsletters
ARTICLES & REPORTS — Apr 22, 2022
by Gil Shefi and Jean Zottner
The financial world is complex and fast-changing. In this everchanging landscape, one aspect that is always cherished and welcomed is stability as it allows better planning and increases certainty.
FRTB Modellability in that respect is no different. Fluctuating modellability can create uncertainty around banks' market-risk capital and thus add another layer of complexity to risk management and risk-taking appetite, potentially leading to concentration risk should banks decide to opt out of instruments that are less frequently observed.
This phenomenon is observed in different areas but is most prevalent in the Fixed-Income (Cash Bonds) space.
When thinking about stability of modellability, it is essential to mention that it is not only the current modellability ratio that is analysed here, which is one important aspect touched upon throughout this article, but also measuring how the modellability of risk-factors (RFs) changes over time. In other words, if a particular RF is modellable today, what is the probability it will remain modellable in one or even three years?
To investigate the stability of RFs over time, the following six groups of RFs have been chosen (using the regulatory buckets as portrayed in the BCBS text in Paragraph 31.16), analysing three years' worth of data between 31-March-19 and 31-March-22, leveraging our deep and wide Transactional Data coverage, accumulated over the years of having a modellability service in production:
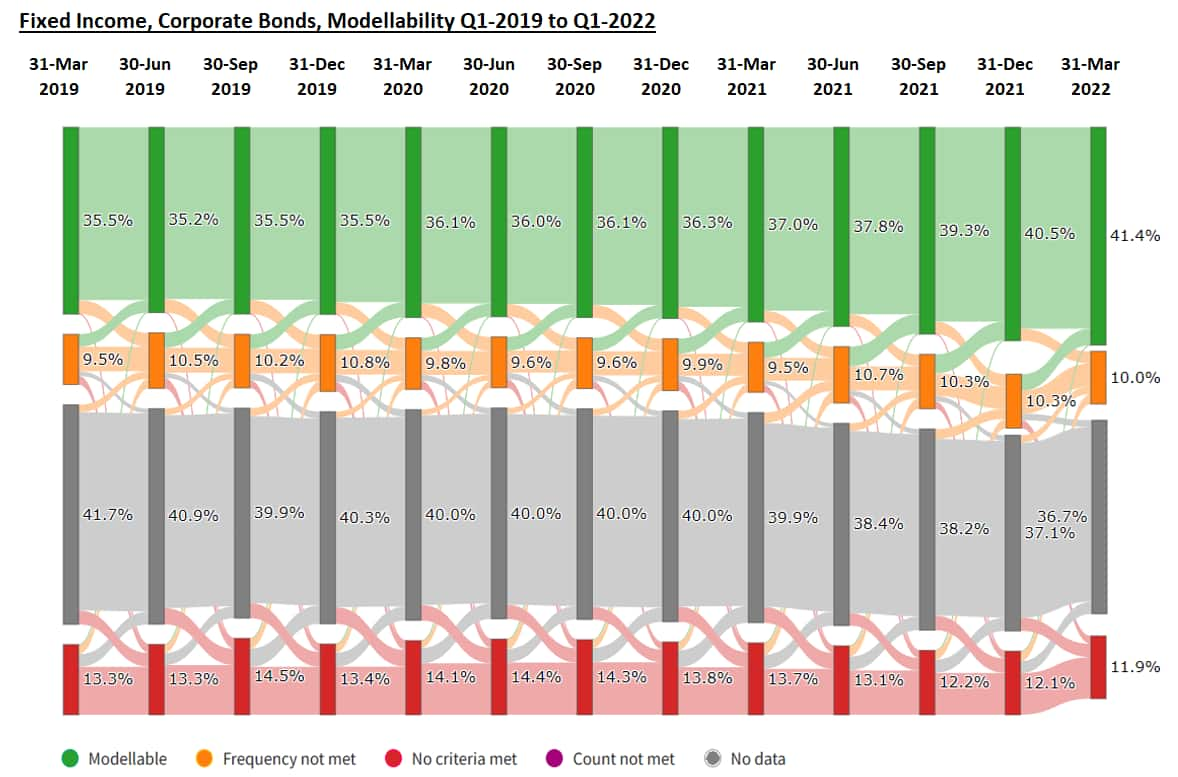
For Government Bonds (Figure 1 below) and Corporate Bonds (Figure 2), the overall modellability remains broadly the same over the three years. Around 45% of all Government issuers/maturities and 36%-40% of all Corporate issuers/maturities are modellable. However, the Sankey diagrams used to analyse the change shows a high level of churn between Modellable Risk Factors (MRF - green) and Non Modellable Risk Factors (NMRF - yellow, red and grey), so we looked deeper into the likelihood of a RF that was modellable in 31-March-19 to remain modellable in 31-March-20 or even 31-March-22. The picture now tells a different story.
In the Corporate Bond space, within one year, more than 25% of the Issuers/maturities will turn NMRF and more than 40% of these RFs will turn NMRF within three years. In the Govies space, the picture is slightly better with shy of 20% of the RFs turning NMRF after one year and a tad over 25% after three years.
These findings are not very surprising as bonds tend to trade (or be quoted) more around issuance, but if bought and held, this means that quite a large portion of the portfolio could turn NMRF, incurring higher capital charge.
Figure 1: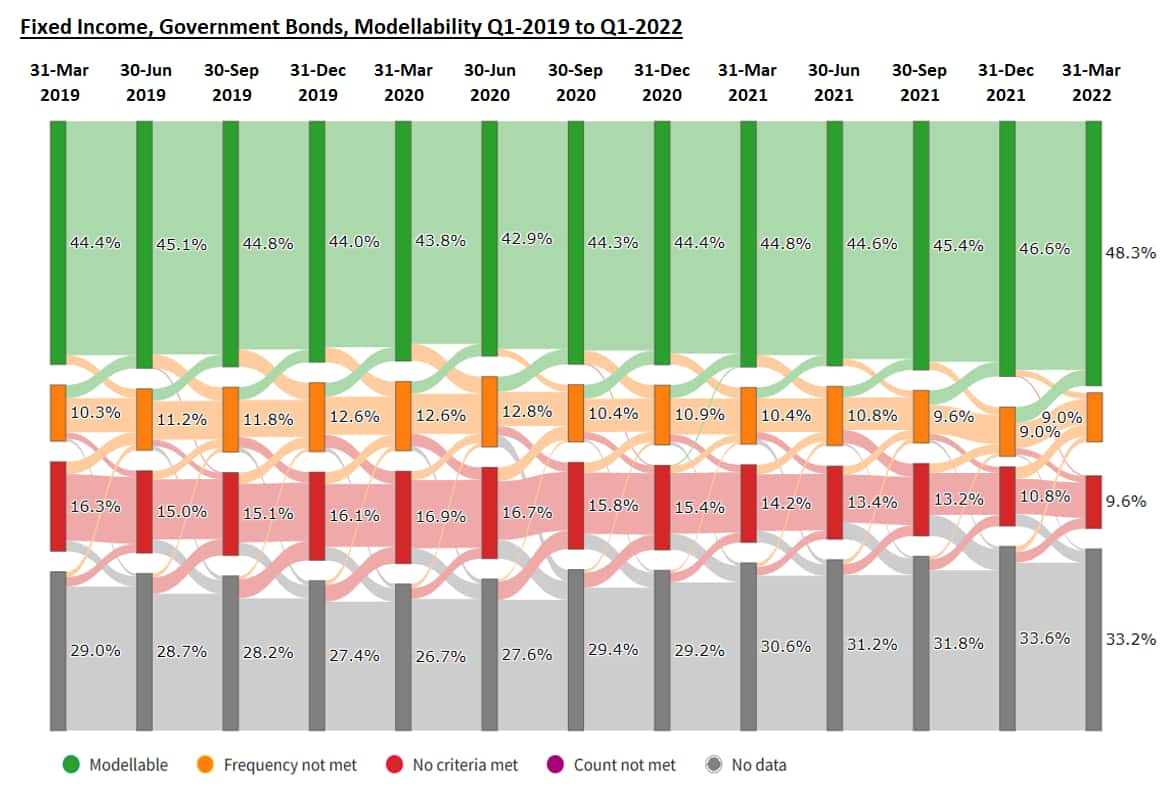
Figure 2:
To understand if the findings in the Fixed-Income space are unique to this market, we examined further the modellability of IR Linear and FX non-Linear instruments, breaking them down between G4 and non-G4 currencies, as mentioned above.
The picture here is somewhat different both by looking at the modellability trend and examining the stability of RFs over time.
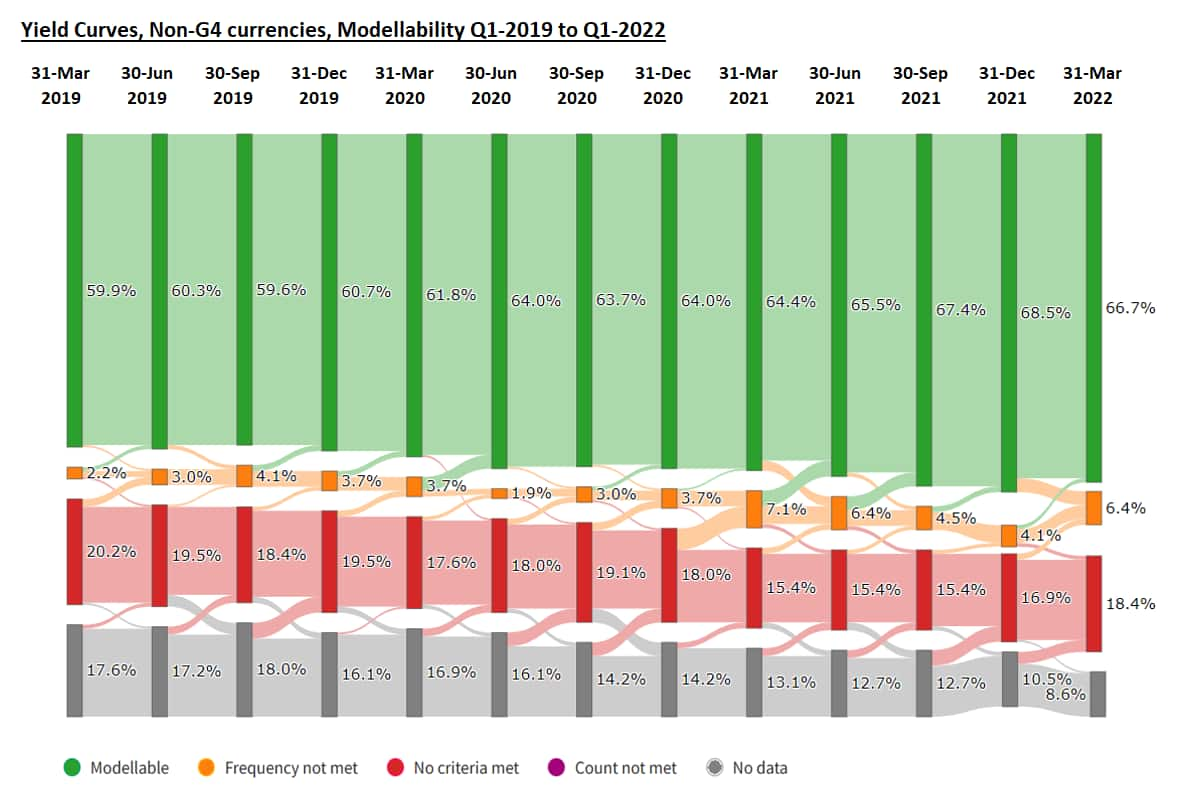
Starting with Interest-Rates Yield Curves (Figure 3 and Figure 4 below), this is probably the most desired pattern with a consistent growth in modellability and diminishing unobservable buckets, mainly for G4 currencies but also, albeit to a lesser degree, for non-G4 currencies. This is coupled with less than 5% of RFs changing modellability status over the three years investigated for both groups.
Figure 3: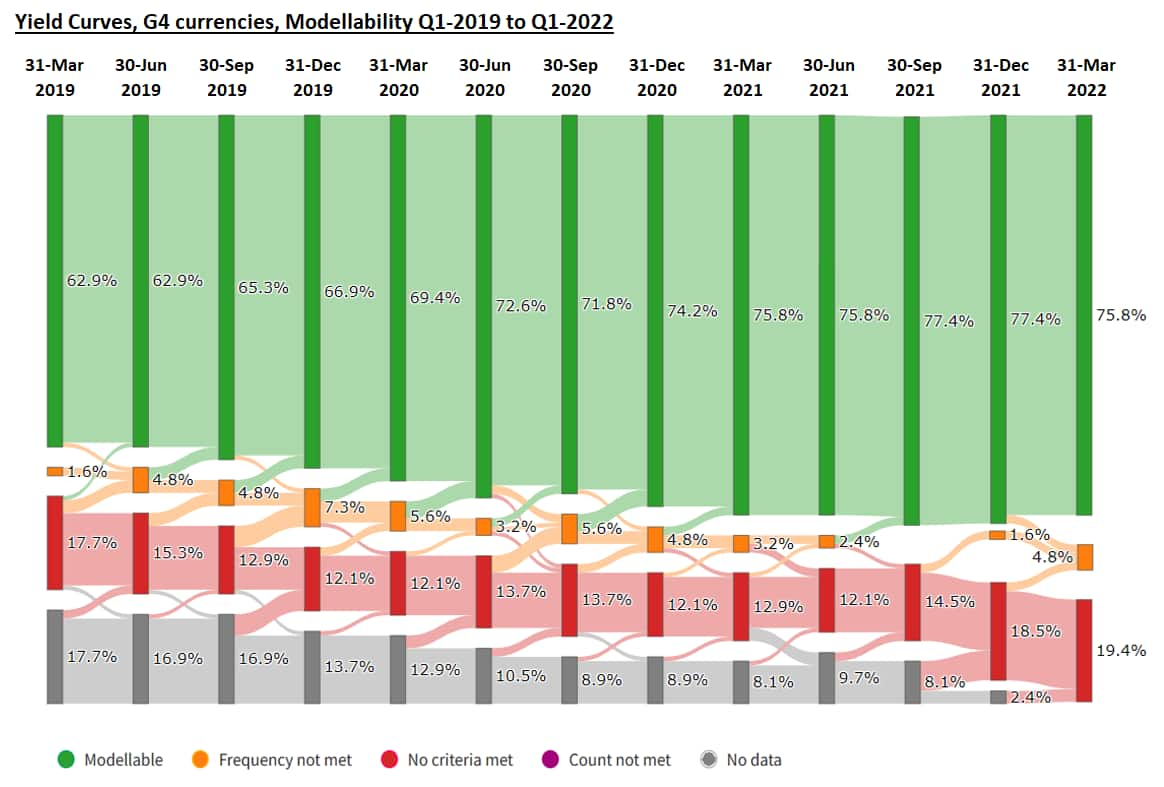
Figure 4:
This fairly significant growth in modellability of the G4 currencies can be partly attributed to the various Risk Free Rates (RFRs) becoming more and more modellable, reaching nearly 100% across the entire term-structure as can be seen in Figure 5 below, while the legacy IBOR rates still remain modellable.
Figure 5:
Next, examining FX vanilla options reveals a mixed and quite an alarming picture, especially regarding the G4 crosses. As shown in Figure 6 below, there is a clear downwards trend in the FX volatility surface modellability of the G4 crosses, from 36% on 31-Mar-19 to 22.5% on 31-Mar-22. As for the stability test, done by measuring the likelihood of seeing a RF that was modellable in Mar-19 to remain modellable after one year or three years, like in the Corporate Bonds space, after one year we observe 20% of the RFs becoming non-modellable and nearly 40% after three years. But unlike Corporate Bonds, where new Issuers turned modellable keeping the overall level of modellability consistent, in the major FX pairs, no new RF buckets replace those turning NMRF, leading the modellability ratio to fall to 22.5%.
Figure 6:
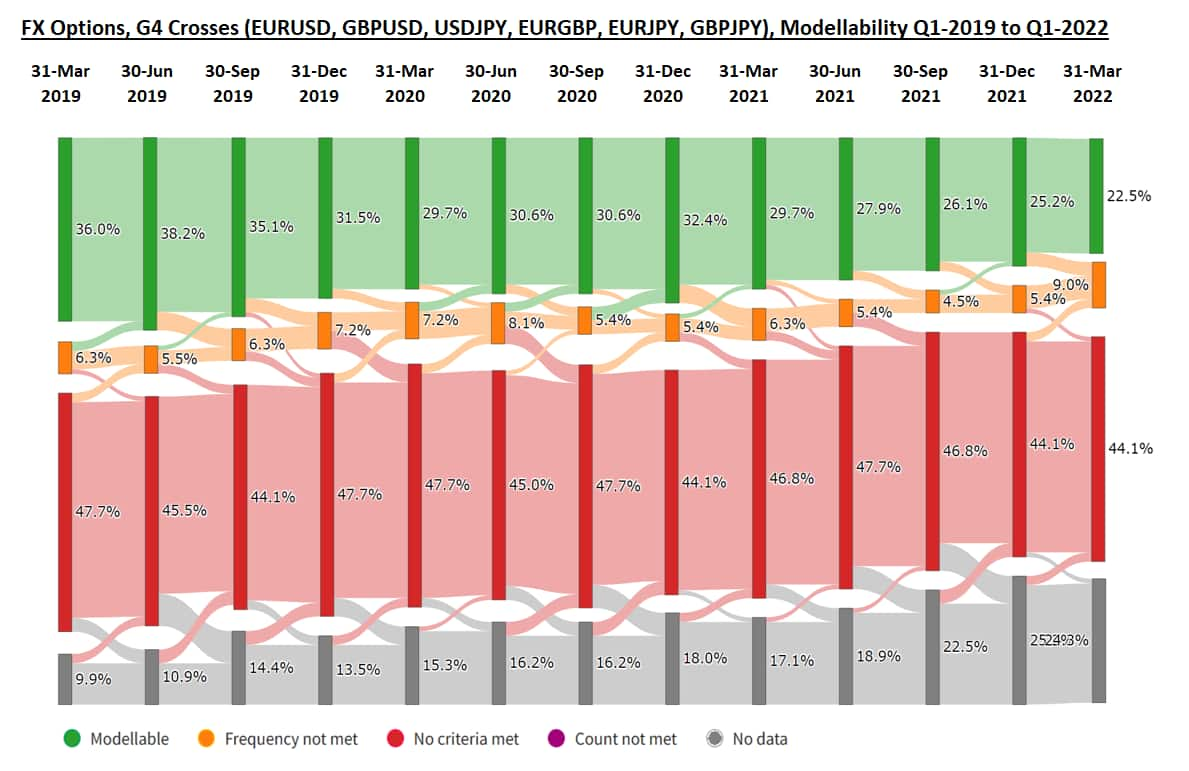
To understand this somewhat alarming finding, we have dug deeper into the data, looking to see if we observe a decline in the number of Real Price Observations (RPOs) or whether there was a shift in trading pattern, moving away from the traditional major pairs to other currencies and/or shift in moneyness.
While our overall universe of FX Options RPOs remained roughly the same between March-19 and March-22, we observed the following two trends that could help explain at least to some extent the trend identified in Figure 6 and Figure 7:
a) Convergence of trades towards ATM, with the In-The-Money / Out-The-Money (ITM/OTM) activity declining quite sharply, especially with majors.
b) Shift of trading from major currency pairs to non-major.
A BIS Triennial Survey has kicked off in April-2022, with results expected to be published towards the end of the year. While the BIS traditionally do not publish findings on moneyness, it will be interesting to see if the shift we have observed from majors to non-major currencies, while not tectonic, will also be observed in their report.
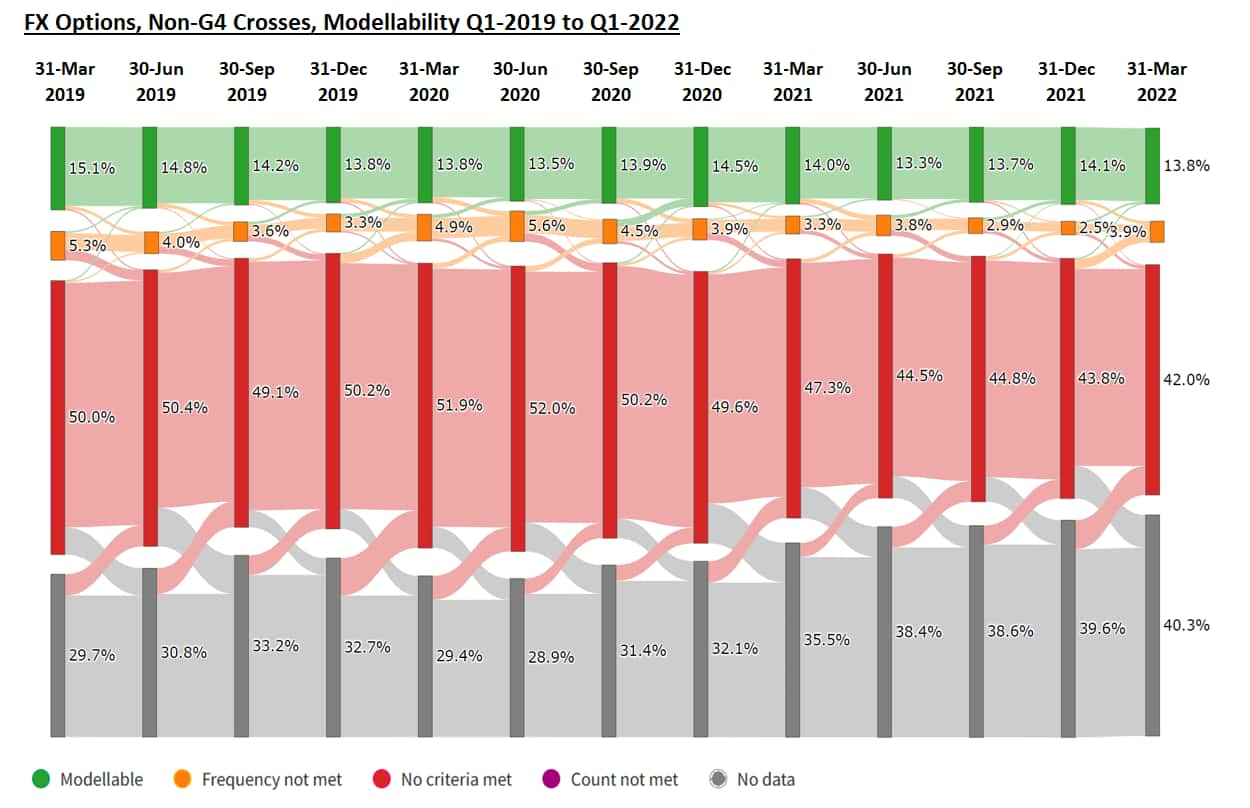
As for the FX Option Volatility on non-G4 crosses, the picture, as seen in Figure 7 below reveals a very constant, relatively low modellability ratio of 15%. This is not very surprising given the fact that we observe around 150 pairs. An interesting finding is the relatively large number of RFs that transition between grey and red buckets with observability coming in and out without ever turning modellable. Looking at the stability rate, the picture here is not as dramatic as for Corporate Bonds or FX G4 but not as good as IR, with around 17% of RF buckets turning NMRF after one year and approximately 25% after three years.
Figure 7:
Different market participants often ask us, banks and regulators alike, what the impact of specific events is on modellability. A recent one was the March-2020 turmoil in the markets over the outbreak of Covid.
Given the relatively short-lived impact Covid had on the financial markets, and the 12 months lookback period required for measuring modellability, it seems Covid cannot be the explanation for our findings. In the Fixed-Income space, this appears to be just the nature of the market.
In FX, however, this seems to stem from a more fundamental shift in trading appetite than a reaction to a specific event. As mentioned above, there is a general trend away from G4 to other pairs. One hypothesis to examine is whether this shift in activity is concentrated in a single currency or distributed amongst the many "other" pairs for which we observe RPOs, but just not enough to turn them modellable. One currency that stands out is CNY, especially against AUD (x3 number of trades in 2022 vs. 2019) and against EUR (x2 number of trades in 2022 vs. 2019). This does not explain the drop in G4 modellability but is a good indication of the overall trend and possibly a signal of the Yuan gradually increasing its dominance as a new reserve currency.
Another point to make is the criticality of examining modellability over time and not as a point in time in the FRTB decision-making process. Deciding on desk structure and other IMA related issues based on a single point in time can be misleading and drive towards a wrong decision.
Having access to a long enough "modellability time-series" with the ability to run multiple what-if scenarios can and should help banks in refining their decisions and optimising the outcomes for the years ahead.
Gil Shefi , Managing Director-FRTB, S&P Global
Gil Shefi serves as a managing director in Market Intelligence at S&P Global and is responsible for Trade-Data initiatives, mainly focusing on FRTB and Fair Value Hierarchy (a.k.a. Leveling), as well as engagement with regulators on these topics
With more than twenty years' experience in the financial industry, he joined IHS Markit to build its OTC Derivatives Data service. Previously, Gil was running SuperDerivatives' Valuation and Data services and prior to that worked as an FX trader.
Jean Zottner, Executive Director, Product Manager, Financial Risk Analytics, S&P Global.
Throughout his career, Mr. Zottner has worked on the multiple aspects of product management, quantitative risk, and system development. With over 15 years of experience in fintech and banking, he is an expert in quantitative risk and product design. He is passionate about using technology to solve business challenges and to streamline processes.
Mr. Zottner holds an MSc in Computer Science obtained with distinction from Oxford University, as well as an Engineering degree from ENSIIE, a French Grande Ecole.
About Financial Risk Analytics
We offer a suite of solutions for FRTB, which enables banks to comply with the new Basel market risk requirements by supplementing their existing infrastructure and processes. The solutions are designed to shorten FRTB implementation programmes, reduce execution risk and cost, and help firms manage the capital impact of the regulation. They can be implemented on a standalone basis to address specific aspects of the requirements or in combination with one another to provide end-to-end support for FRTB.
www.ihsmarkit.com/TradedMarketRisk
S&P Global provides industry-leading data, software and technology platforms and managed services to tackle some of the most difficult challenges in financial markets. We help our customers better understand complicated markets, reduce risk, operate more efficiently and comply with financial regulation.
This article was published by S&P Global Market Intelligence and not by S&P Global Ratings, which is a separately managed division of S&P Global.
Location