Featured Topics
Featured Products
Events
S&P Global Offerings
Featured Topics
Featured Products
Events
S&P Global Offerings
Featured Topics
Featured Products
Events
S&P Global Offerings
Featured Topics
Featured Products
Events
Financial and Market intelligence
Fundamental & Alternative Datasets
Government & Defense
Banking & Capital Markets
Economy & Finance
Energy Transition & Sustainability
Technology & Innovation
Podcasts & Newsletters
Financial and Market intelligence
Fundamental & Alternative Datasets
Government & Defense
Banking & Capital Markets
Economy & Finance
Energy Transition & Sustainability
Technology & Innovation
Podcasts & Newsletters
BLOG — Mar 30, 2022
Key findings:
GTAS Forecasting latest estimations
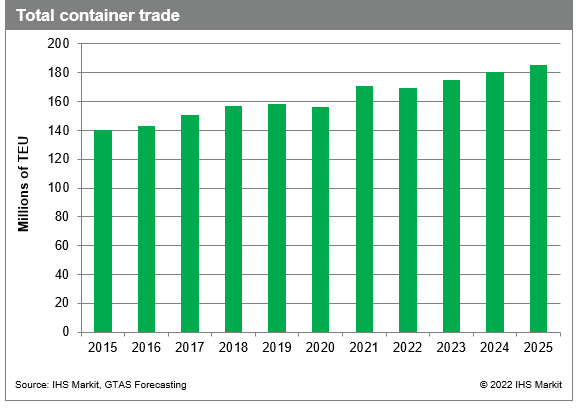
The containerized trade volume decreased by 3.0% in the first quarter of 2020 and by 8.7% y/y in the second quarter of 2020 due to the most severe COVID-19 disruptions at the time. However, the year ended with a decline in global containerized trade volume by only 1.2%, reaching 156.6 million TEU. GTAS Forecasting has noted a strong recovery in container trade during the year 2021 with annual growth amounting to 9.3%, and volumes reaching 171.1 million TEU. The first and second quarters of 2021 marked significant increases by 12.7% and 20.7% y/y. Third quarter of 2021 has already brought a milder growth by 6.3% y/y, while in the last quarter of 2021 a decrease of 0.7% was observed, according to GTAS Forecasting data. The global compound annual growth rate (CAGR) for containerized trade is projected to reach 3.2% in the medium-term (2022-25) and 2.9% in the long-term (2022-30).
* The detailed forecast results are available to our Global Trade Analytics Suites (GTAS) clients only on Connect platform. Contacts IHS Markit Customer Care Customer.Care@ihsmarkit.com for details.

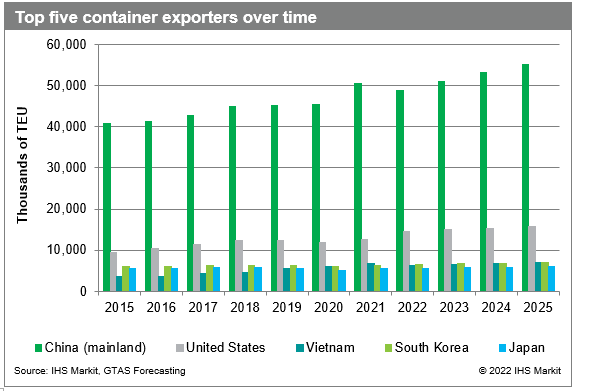
Looking at the global container trade volumes, we can distinguish the top five exporters who were responsible for 47.9% of total global container trade in 2021, with mainland China staying at the top of the ranking, accounting for 29.6%. The volume of U.S. exports stood at 12.6 million TEU in 2021 (5.8% growth y/y) and is projected to reach 14.5 million TEU this year (15.0% increase y/y). Vietnam overtook South Korea in the global container exports ranking in 2021, with the growth rate reaching 15.4% y/y and long-term CAGR projected to reach 3.5% during 2022-30.
The forecast for mainland Chinese exports over the long run (2022-30) suggests an average growth rate of 3.6%, compared with 2.9% CAGR for the United States and 2.8% for South Korea. The share of container trade exports of the top five countries is expected to increase in the long run and account for 49.8% by 2030.

Supply chains disruptions and record high transport costs in 2021
In the year 2021, we have seen supply chains disruptions and massive congestion in ports across North America, Asia, and North Europe because of the pandemic, introduced restrictions, production stoppages, and port closures. Slowing port operations have caused delays and triggered record high container turnaround times, effectively removing more than 10% of global capacity.
We have also seen record high freight rates mainly due to container shortages, reaching its peak in September 2021—over $11,000 per 40-foot container (FEU), according to the Freightos Baltic Global Container Index, published weekly on JOC.com data platform.
Freight rates on most of the trade lanes will continue to increase due to the replacement demand for Russia-Ukraine cargo, with backhaul freight rates remaining the strongest routes. This indicates the need for counterbalancing the loss of coal, grain, steel, and other supplies coming from the Black Sea region.
The world's largest container shipping companies were working hard through the year 2021 to make up for the lack of containers on the market and have expanded their capacity through deployment of new vessels as well as placing orders for hundreds of thousands of new containers to be added to the global fleet.
Outlook for containerized trade among geopolitical tensions
The increase in additional capacity deployed in the year 2021 does not seem to end very quickly, as the trend continues on the main trade routes out of Asia, causing even more pressure on the already overloaded ports of US West Coast and North Europe.
European ports have been struggling with record levels of congestion, increasing even more from October 2021, with very limited chances for relief in the short-term, then the Russian invasion of Ukraine started, making the situation even worse.
At the beginning of March, a lot of cargo destined for Russia was floating on the water, with no guarantee to reach the port of destination of St. Petersburg. The only chance for the goods to reach its final destination was to be transshipped in Northern European terminals, adding to the high level of congestion in the main European hubs. However, a number of hub ports and feeder operators have boycotted Russian cargo. As of 2 March, the largest carriers, including Maersk, CMA-CGM, MSC, and Hapag-Lloyd have also suspended their bookings for cargo going to and from Russia. This comes along with the long list of sanctions imposed on Russia due to its invasion in Ukraine.
Additionally, the inland trade routes through Russia and Belarus are being closed for commercial cargo and there is a battle for air space taking place in Europe (after the UK banned Russian carriers from entering its airspace and the EU imposed wide-ranging sanctions, Russia struck back, closing its air space for all European countries). Thus, we can observe higher demand for maritime transport from Asia to Europe.
All of these factors are leading to deteriorating trade conditions on the Asia-Europe trade route, bringing more pressure to the already highly congested North European ports and resulting in additional container shortages in the region.
The carriers are not seeing any significant relief to the congested supply chains out of Asia in the short-term, stating that the demand will still be high in the first half of 2022, slowing gradually in the second half of the year. In North America, they are also not expecting any notable change by the end of this year, so most probably we would see the supply chain recovery taking place no sooner than 2023.
This column is based on S&P Global Market Intelligence GTAS data. The full version of the article is available for our clients on Connect platform. For more details about GTAS, please visit the product page.
https://ihsmarkit.com/products/maritime-global-trade-analytics-suite.html
Subscribe to our monthly newsletter and stay up-to-date with our latest analytics
Posted 30 March 2022 by Katarzyna Skrzypek, Senior Economic Research Consultant, Global Trade Forecasting, Maritime, Trade & Supply Chain, S&P Global Market Intelligence
This article was published by S&P Global Market Intelligence and not by S&P Global Ratings, which is a separately managed division of S&P Global.
How can our products help you?
