Featured Topics
Featured Products
Events
S&P Global Offerings
Featured Topics
Featured Products
Events
S&P Global Offerings
Featured Topics
Featured Products
Events
S&P Global Offerings
Featured Topics
Featured Products
Events
Financial and Market intelligence
Fundamental & Alternative Datasets
Government & Defense
Banking & Capital Markets
Economy & Finance
Energy Transition & Sustainability
Technology & Innovation
Podcasts & Newsletters
Financial and Market intelligence
Fundamental & Alternative Datasets
Government & Defense
Banking & Capital Markets
Economy & Finance
Energy Transition & Sustainability
Technology & Innovation
Podcasts & Newsletters
ECONOMICS COMMENTARY — Aug 25, 2021
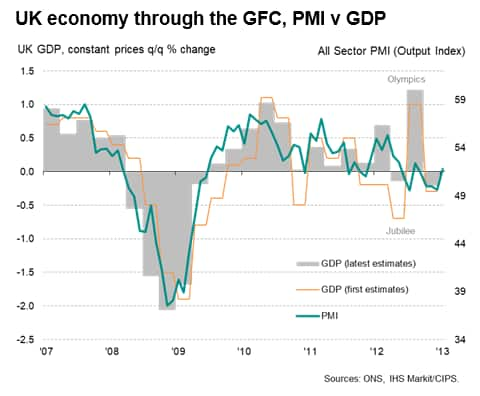
IHS Markit's PMI business surveys provide leading signals of economic change ahead of comparable official data. In this example we look at how the UK PMI surveys accurately foretold of an economic collapse in 2008 some eight months before official GDP data signalled a decline.
Moreover, misleading signals sent by GDP for the second quarter of 2008, which have since been revised lower in line with the PMI, contributed to a delay in the policy response from the Bank of England to the global financial crisis.
In April 2008, the UK all-sector PMI output index (covering manufacturing, services and construction) fell below the no-change level of 50 signalling economic decline. Although at 49.8 the index was only marginally inside contraction territory, it was notable in being the lowest reading for five years.
The survey painted a markedly different, and gloomier, picture of the health of the economy than the official data available at that time. GDP had risen 0.4% in the first quarter of 2008, according to the Office for National Statistic's initial estimate, presenting no hint at any economic downturn and encouraging the UK Treasury to stick to its forecast that GDP growth would be 1¾% to 2¼% in 2008. The Bank of England's Monetary Policy Committee had meanwhile voted 8-1 in favour of keeping interest rates unchanged at the May 2008 meeting.
The five-year low April 2008 reading was the start of a dramatically weak second quarter. By June 2008, the all-sector PMI output index had sunk to 45.3, its lowest since comparable data were available in 1998 and indicative of GDP falling at a quarterly rate of approximately 0.6% (1) . The index fell further in July, to 45.2.
However, these worrying ten-year-low PMI readings again contrasted with the official GDP data that were then released for the second quarter, the initial estimate of which - released in July - put quarter-on-quarter growth at 0.2%.
The GDP reading contributed to the MPC once again voting to keeping policy unchanged in August 2008, with one of the eight committee members even voting for higher interest rates, concerned about spiking price pressures, with just one member voting for a cut. The Minutes also noted that "The Committee's central projection was for output to be broadly flat in the early part of the forecast period" and that "economic growth was projected to pick up gradually thereafter".
In September 2008 the MPC continued to vote to keep policy unchanged, albeit with D Blanchflower now arguing for a 50 basis point cut
We now know that the GDP data were in fact sending seriously misleading signals to the policymakers.
The 0.2% increase in GDP in the second quarter of 2008 has subsequently been revised down to register a 0.6% contraction of the economy, in line with the PMI readings at that time.
It was not until 24th October 2008, with the publication of the third quarter GDP data showing a 0.6% contraction of the economy, that the official GDP data signalled any marked deterioration in the UK economy's health.
Note that by the time the official GDP data had started to signal an economic decline. the PMI's all sector output index had collapsed to a new all-time low of 44.1 and had been signalling contraction for some six months.
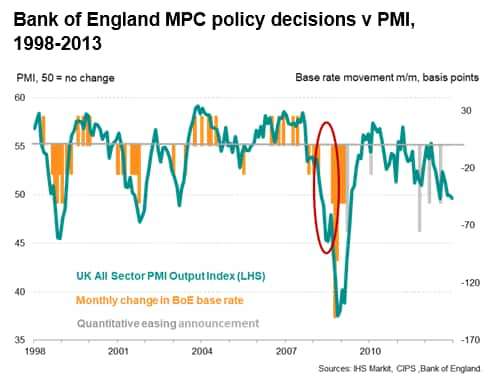
The delay in the GDP data responding to real world events meant it was also not until October 2008 that the MPC voted to cut interest rates, from 5.0% to 4.5%, with the third quarter GDP collapse encouraging a further slashing of base rate to 3.0% in November 2008.
This delay in loosening policy is clearly highlighted when policy decisions are tracked against the PMI:
1 Based on a simple OLS regression
Chris Williamson, Chief Business Economist, IHS Markit
Tel: +44 207 260 2329
chris.williamson@ihsmarkit.com
© 2021, IHS Markit Inc. All rights reserved. Reproduction in whole or in part without permission is prohibited.
Purchasing Managers' Index™ (PMI™) data are compiled by IHS Markit for more than 40 economies worldwide. The monthly data are derived from surveys of senior executives at private sector companies, and are available only via subscription. The PMI dataset features a headline number, which indicates the overall health of an economy, and sub-indices, which provide insights into other key economic drivers such as GDP, inflation, exports, capacity utilization, employment and inventories. The PMI data are used by financial and corporate professionals to better understand where economies and markets are headed, and to uncover opportunities.
This article was published by S&P Global Market Intelligence and not by S&P Global Ratings, which is a separately managed division of S&P Global.
Location


