Featured Topics
Featured Products
Events
S&P Global Offerings
Featured Topics
Featured Products
Events
S&P Global Offerings
Featured Topics
Featured Products
Events
S&P Global Offerings
Featured Topics
Featured Products
Events
Financial and Market intelligence
Fundamental & Alternative Datasets
Government & Defense
Banking & Capital Markets
Economy & Finance
Energy Transition & Sustainability
Technology & Innovation
Podcasts & Newsletters
Financial and Market intelligence
Fundamental & Alternative Datasets
Government & Defense
Banking & Capital Markets
Economy & Finance
Energy Transition & Sustainability
Technology & Innovation
Podcasts & Newsletters
BLOG — May 10, 2021
Following our initial flash analysis in mid-January (available here) and our January review (available here) we have received a great deal of interest for an update of the activity in the global OTC interest rate derivative markets post Brexit throughout Q1 2021.
We have contributed to a joint report with Deloitte (available here) entitled "European capital markets: The regulatory considerations for banks as they move beyond Brexit" which contains highlights of the below analysis. However, for completeness we are providing the full analysis below.
First, to recap why there was so much interest, the transitional period ended on 31 December with no relief for European Union (EU) firms on the derivatives trading obligation (DTO) from the European Commission (EC) and only limited adjustments from the United Kingdom (UK). Despite largely identical rules, no equivalence was granted between jurisdictions. This left many firms with conflicting and incompatible DTOs in the EU and the UK and no apparent option other than to trade the relevant derivatives on a US Swap Execution Facility (SEF), or in Singapore. US firms remained subject to the CFTC's Made Available to Trade (MAT) requirements.
Current position:
This means that EU, UK and US firms can access global on-venue liquidity but, UK firms cannot access EU venues (except in some special cases where temporary relief is available) and EU firms cannot access UK venues. This has created some specific challenges:
Since our last analysis, the EU-UK Memorandum of Understanding (MoU) establishes a framework for voluntary regulatory cooperation in financial services. The MoU will launch a Joint UK-EU Financial Regulatory Forum, which will serve as a platform to facilitate dialogue on financial services issues. However, the impact of the MoU should not be overstated. Although an important step in ensuring an effective EU-UK relationship around financial services, it is simply an administrative agreement to have regular exchanges of information. However, in itself, it does not bring forward any changes in regulatory arrangements such as equivalence for the DTO. The CFTC also granted No action relief through letter number 21-09 dated April 7, 2021 which provide relief for U.S. swap dealers (SDs) from certain transaction-level requirements for certain swaps between their foreign branches and non-U.S. persons (by adding the UK to the existing relief, six become seven).
IHS Markit has assessed the Q1 2021 data processed by IHS Markit's MarkitWire platform to assess the impact of Brexit on single currency interest rate swaps (IRS)[i] trading for the three currencies subject to the DTO in the EU and the UK and the MAT requirements in the US, analysing market share in EUR, GBP, and USD swaps: all, on venue, dealer-to-dealer, dealer-client, a proxy for DTO/MAT and non-DTO/MAT, cleared as well as total volumes and notional traded.
EUR: All Swaps
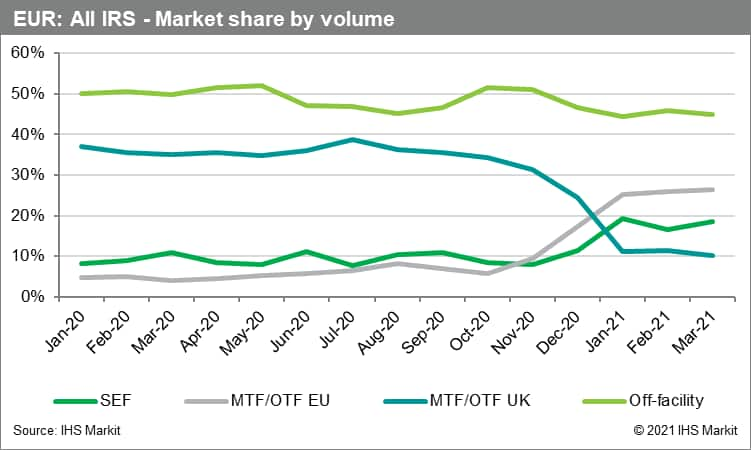
For EUR all swaps only, we looked back an additional 6 months to January 2020 to establish if there had been much change prior to July 2020, other than a gradual shift from 5% to 7% for EU MTF/OTFs, there hadn't…
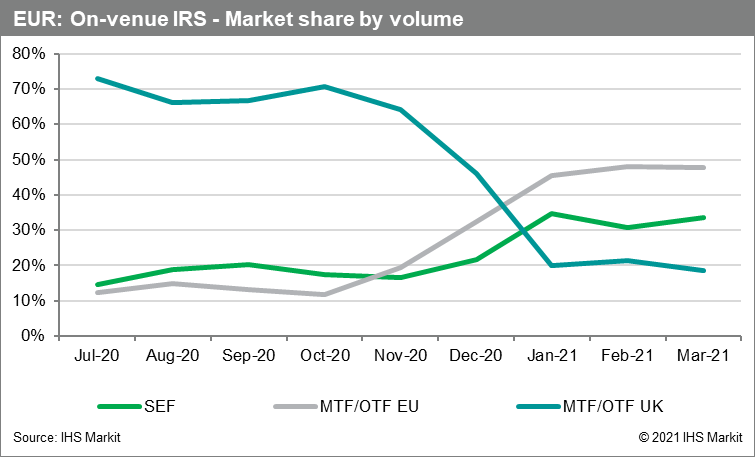
On-venue EUR swaps
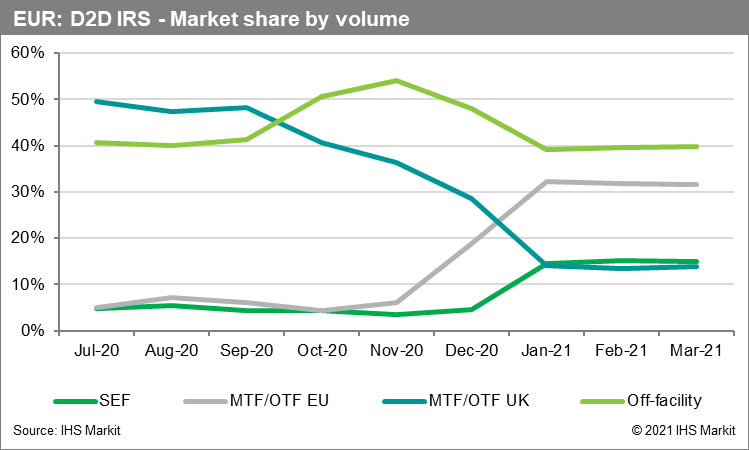
EUR Dealer to Dealer Swaps
EUR Dealer to Client Swaps
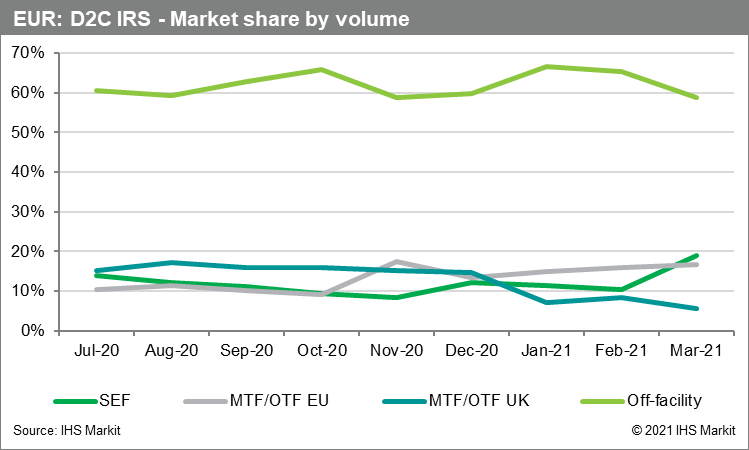
The striking difference between EUR Dealer to Dealer and EUR Dealer to Client graphs is that shift to EU venues is much smaller albeit from a higher start; D2D from 5% to 32% and D2C from 10% to 17%. This represents the fact that EU clients are more likely to have already been trading on EU venues where EU banks were likely to access both EU and UK venues.
Also, the shift to SEF for EUR Dealer to Dealer swaps occurred instantly jumping from 5% in December to 15% in January. Whereas the shift to SEF for EUR Dealer to Client swaps occurred later jumping from 10% in February to 19% in March. This could be driven by the FCA relief allowing time for EU clients to trade with UK banks on EU venues until the EU clients were ready to trade on a SEF.
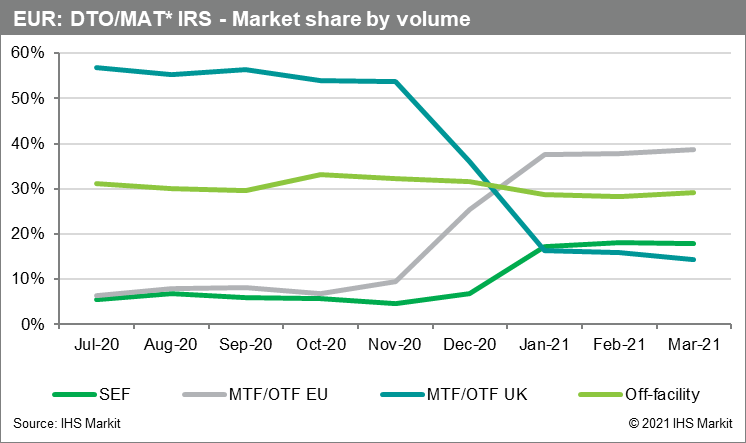
EUR Swaps subject to a trading obligation (DTO/MAT[ii])
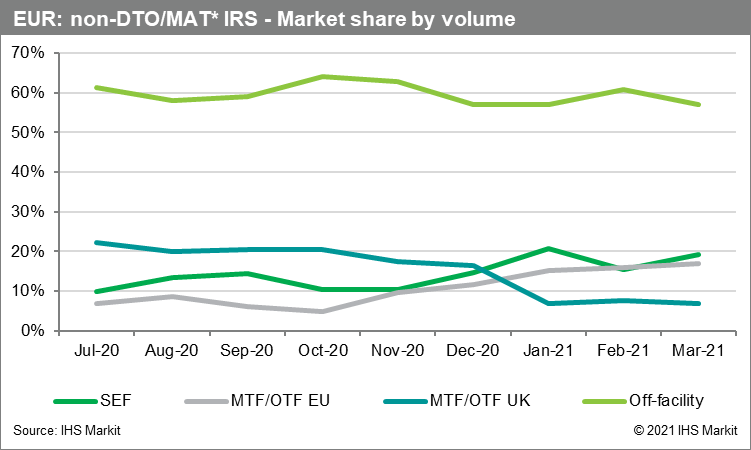
EUR Swaps not subject to a trading obligation (DTO/MAT)
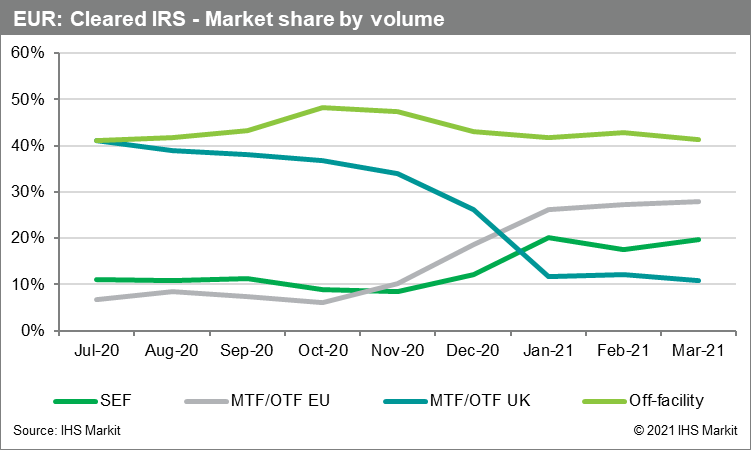
EUR Cleared[iii]Swaps
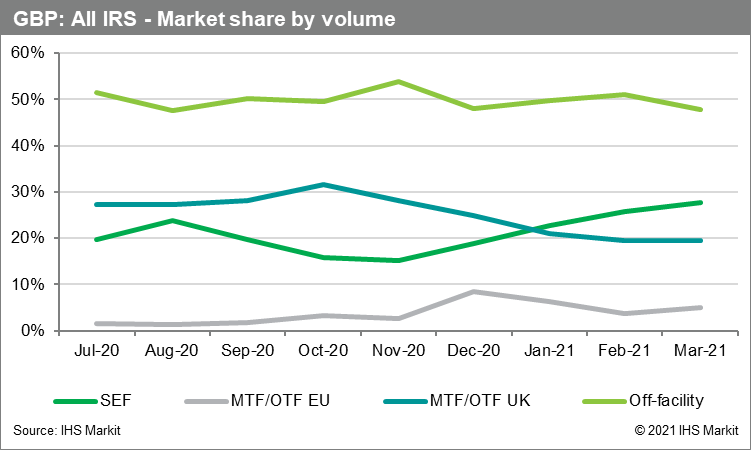
GBP swaps
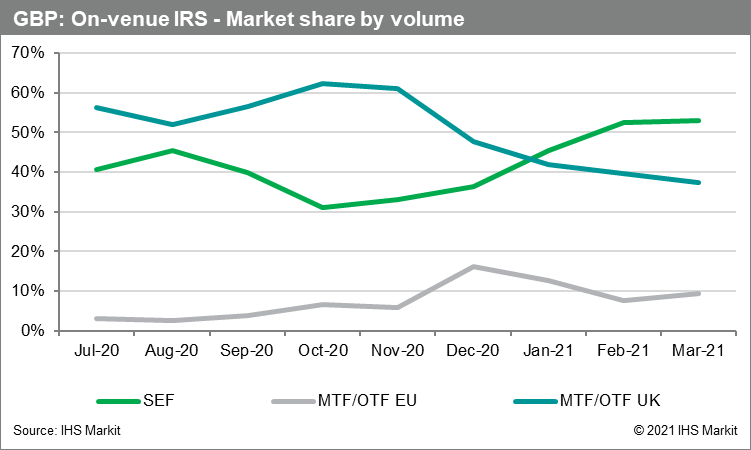
On-venue GBP swaps
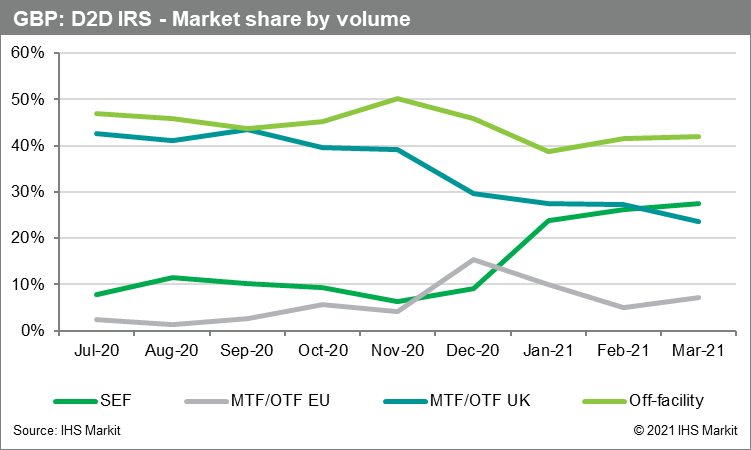
GBP Dealer to Dealer Swaps
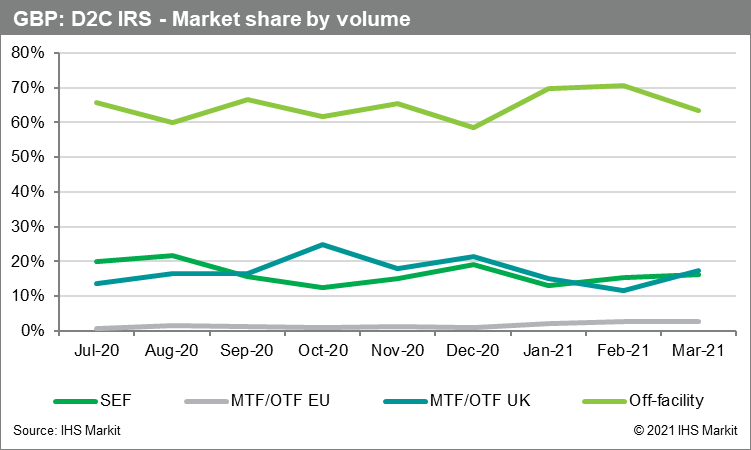
GBP Dealer to Client Swaps
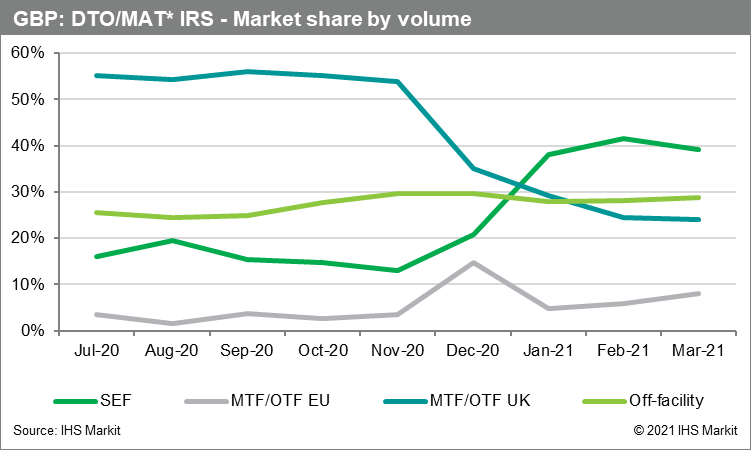
GBP Swaps subject to a trading obligation (DTO/MAT)
However, this data comes with a health warning. What stands out in the raw data is that the number of trades fell sharply across all categories excluding SEF which had a small increase. This is driven by firms trading more non-MAT products due to firms switching from GBP-LIBOR trading (which is subject to DTO/MAT) to SONIA (which is not) as part of the IBOR reform efforts. This doesn't mean that the SONIA swaps aren't traded on a venue, they often are (see the next section) it is just that they aren't technically subject to DTO/MAT. What this data is potentially showing is that UK firms are progressing faster in the migration from GBP-LIBOR to reformed SONIA.
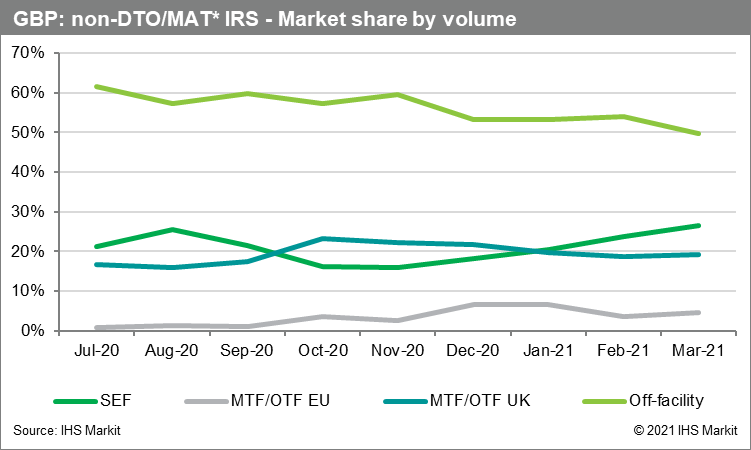
GBP Swaps not subject to a trading obligation (DTO/MAT)
The majority of GBP IRS trades are non-DTO/MAT. This is driven by firms trading more non-MAT products due to firms switching from GBP-LIBOR trading (which is subject to DTO/MAT) to SONIA (which is not) as part of the IBOR reform efforts.
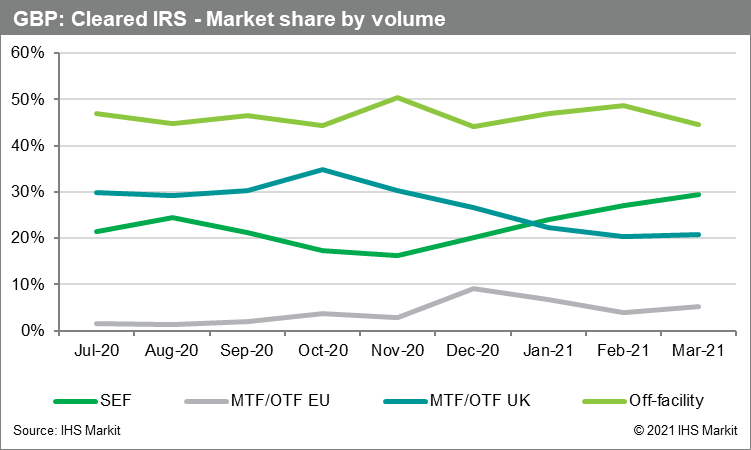
GBP ClearedSwaps
All USD swaps
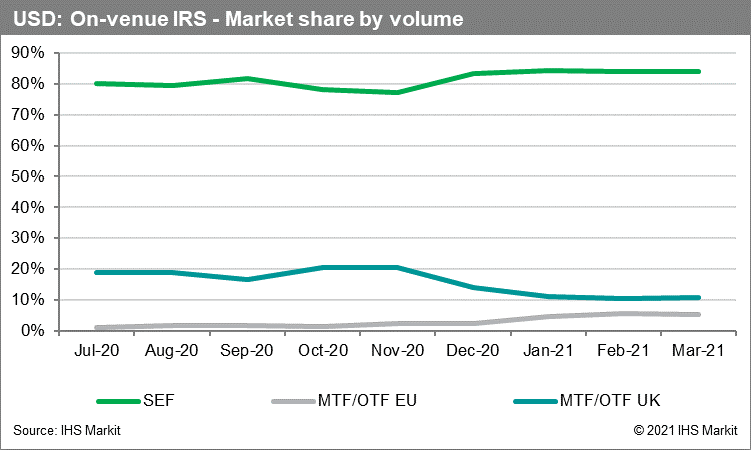
On-venue USD swaps
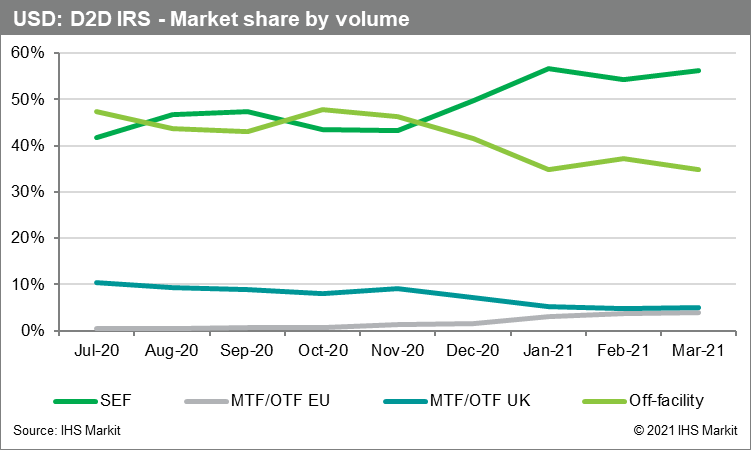
Dealer to Dealer USD Swaps
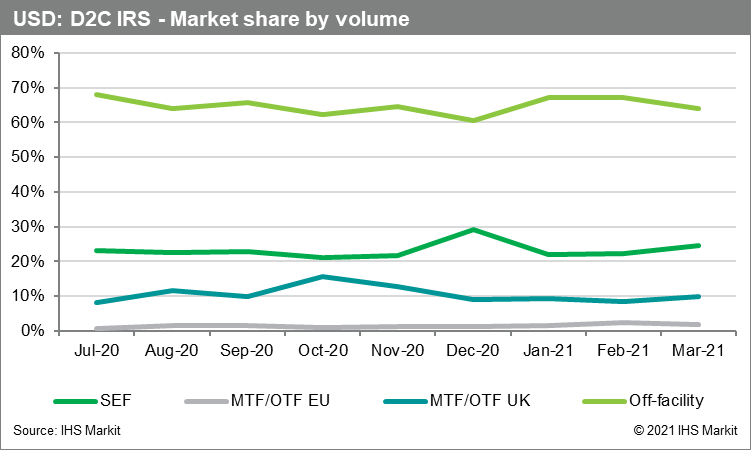
Dealer to Client USD Swaps
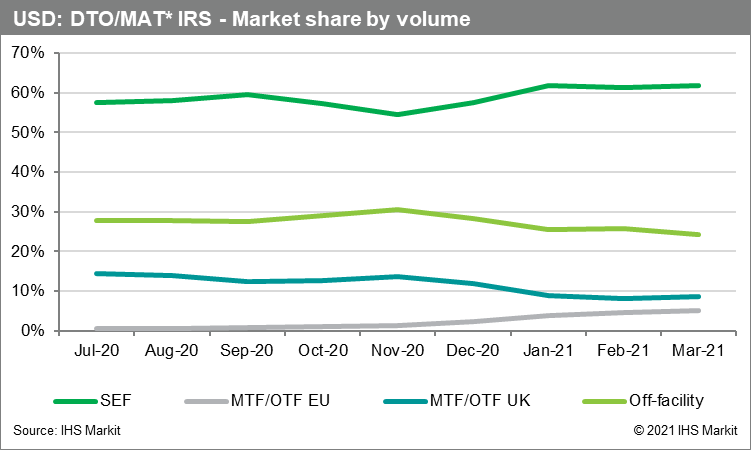
USD Swaps subject to a trading obligation (DTO/MAT)
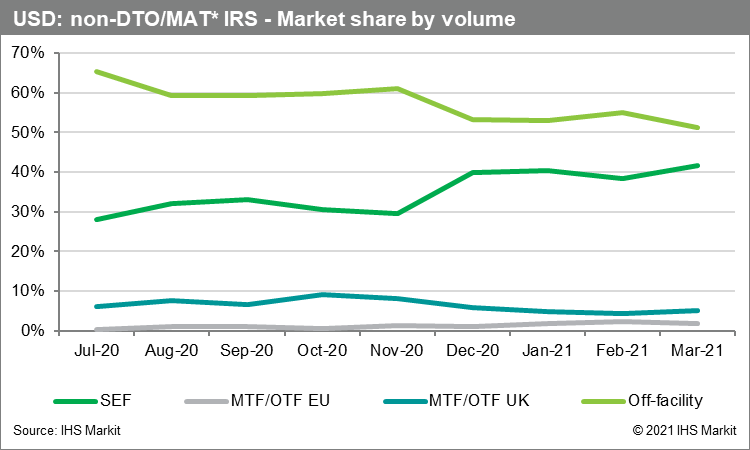
USD Swaps not subject to a trading obligation (DTO/MAT)
USD ClearedSwaps
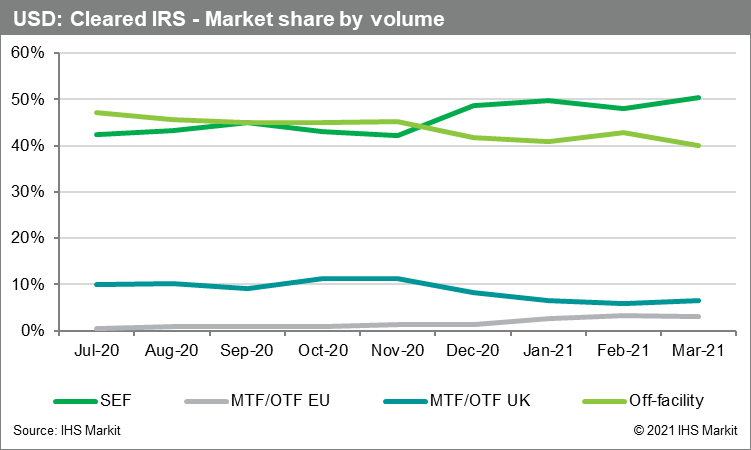
We have received many requests to size the impact of the shift in terms of the number of trades and the notional traded. In order to assess this, we used July 2020 as the pre-Brexit market share and March 2021 as the post Brexit market share. The change in each currency was then applied to the total number of swaps in that currency to calculate the impact in March 2021 in terms of the number of trades in that currency. We then applied the March 2021 average trade size for each currency to the applicable number of trades to calculate the impact in March 2021 in terms of the aggregate notional of trades in that currency.
EUR Swaps
GBP Swaps
USD Swaps
In aggregate[iv]for GBP, EUR and USD combined
The decrease in trades on UK venues in March (based on July 2020 base) is less than the combined increase in trades on EU venues and SEFs because the share of off-facility also fell between July 2020 and March 2021.
The relationship between number of trades and notional is not linear as the average size of a trade varies by currency. E.g. The average USD swap in March was approximately 50% bigger than the average EUR swap on a constant currency basis.
Percentages quoted are rounded to the nearest percent. Exact percentages were used to calculate the number of trades and notional.
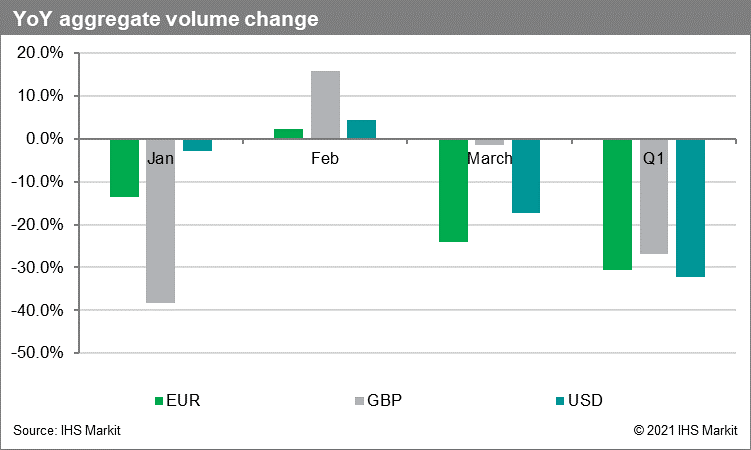
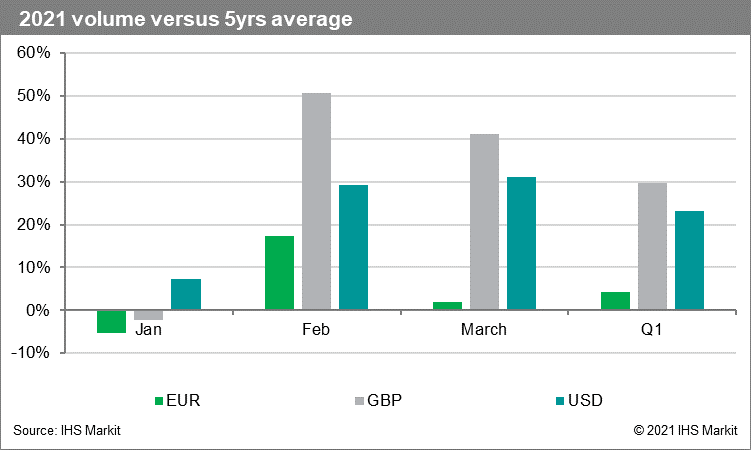
Volumes were relatively weak across the three currencies in January 2021 both on a year-on-year basis (YoY[v]) and versus a 5 year average. Volumes have been stronger in February and March albeit lower than March 2020 which saw elevated volumes due to the COVID-19 pandemic which drove record volumes.
For the full summary, please refer to our joint report with Deloitte (available here) entitled "European capital markets: The regulatory considerations for banks as they move beyond Brexit" which contains highlights of the below analysis.
For completeness we are providing the conclusions from the above data below.
Trading volumes on UK venues declined
Trading volumes on UK MTFs and OTFs fell in Q1 2021 across all three currencies, compared to the prior six months. The largest decline was for EUR IRS, where the market share of UK venues fell by 29% between July 2020 and March 2021. The market share of UK venues fell by 7% for GBP IRS and by 3% for USD IRS, although in absolute terms the fall for USD IRS was slightly larger. In aggregate across the three currencies, trading volumes on UK venues fell by approximately 19,300 trades, representing a fall in aggregate notional of £2.3 trillion.[vi]
Overall, more trading went to US venues than EU venues
The market share of EU MTFs and OTFs grew by 19% for EUR IRS, 4% for GBP IRS and 3% for USD IRS between July 2020 and March 2021. The market share of SEFs[vii] grew by 11% for EUR IRS, 8% for GBP IRS and 9% for USD IRS between July 2020 and March 2021. In aggregate across the three currencies, more trading went to US venues than EU venues, as SEF trades grew by approximately 15,000 trades (£2.4 trillion aggregate notional) and EU venue trades grew by approximately 13,000 trades (£1.6 trillion aggregate notional).
Beyond what was required by regulation, EUR IRS trading volumes shifted from UK to EU and US venues
The EU, UK and US regimes all contain requirements for in-scope firms to trade specified products on specified venues.[viii] Stripping out the transactions in products subject to these requirements, there was still some shift in trading from UK to EU and US venues, mainly for EUR IRS.[ix] This means that some trading volumes in EUR IRS left UK venues, beyond what was strictly required by regulation.
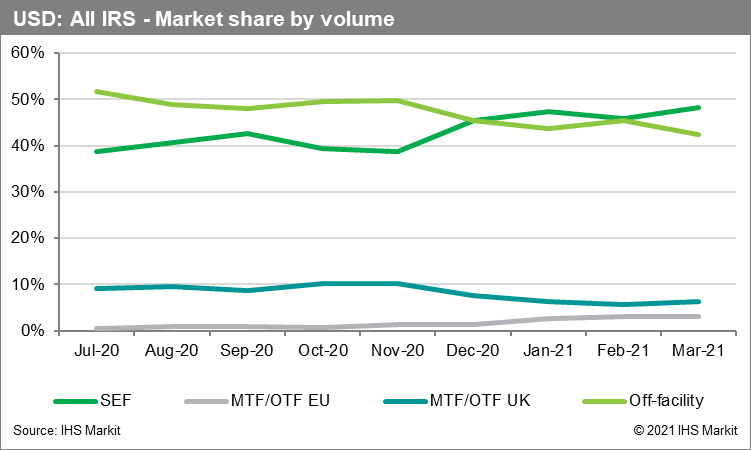
Between July 2020 and March 2021, the market share of EUR IRS trading fell by 15% on UK venues, but grew by 10% on EU venues and 9% on SEFs. This could mean that the volume shift of some EUR IRS products has acted as a pull for further EUR IRS products to be traded in the EU, or it reflects the difficulty in distinguishing between DTO and non-DTO products, making it more straightforward for many EU clients to transact all their EUR IRS on an EU venue. The market share of USD IRS on SEFs also grew by 14%. This was potentially drawn by the concentration of the USD IRS market on SEFs; looking at all swaps, trading volumes on SEFs for USD IRS increased from 39% in July 2020 to 48% in March 2021. Other than that, trading volume changes for the other currencies and venues were not very significant and in fact GBP IRS trading on UK venues grew by 2%.
The shift in trading volumes has been more significant in D2D than D2C markets and D2D markets reacted more quickly than D2C EUR IRS markets
The same pattern can be seen in the D2D markets as in the markets for all IRS, although overall the swings are more pronounced. Trading volumes on UK venues fell across the three currencies, while they rose for EU venues and SEFs across the three currencies. Also, while the main shifts happened in January 2021, we can observe some shifts already starting in November and December ahead of the end of the Transition Period.
For D2C markets, we can observe a similar, although less pronounced, pattern for EUR IRS and to a lesser extent in GBP and USD IRS markets. Trading volumes fell on UK venues, but rose on EU venues and SEFs. The fact that the pattern was less pronounced in D2C than D2D markets may be due to the fact that EU clients were more likely to have already been trading on EU venues, whereas EU banks were more likely to access both EU and UK venues.
While D2D markets appear to have started to react ahead of the end of the Transition Period, the shift to SEF for EUR D2C markets appears to have occurred in March. This delayed shift to SEF could have been facilitated by the FCA relief, which allows, subject to conditions, UK banks subject to the UK DTO to trade on EU venues with, or on behalf of, EU clients where their EU clients do not have access to a SEF. EU clients may have used this time to make arrangements to access a SEF.
Some EU and UK banks and EU and UK clients have reduced market access
EU banks which do not have UK subsidiaries can no longer access 14% of the EUR DTO IRS market, 24% of the GBP DTO IRS market and 9% of the USD DTO IRS market that occurs on UK MTFs / OTFs.
UK banks which do not have EU subsidiaries can no longer access 39% of the EUR DTO IRS market, 8% of the GBP DTO IRS market and 5% of the USD DTO IRS market that occurs on EU MTFs / OTFs, except where trading with, or on behalf of, EU clients subject to the EU DTO which do not have access to a SEF.
Clients in the UK and EU have reduced choice about where to execute trades as, where the transactions are subject to a EU/UK DTO, clients in the UK are unable to trade on EU venues and clients in the EU are unable to trade on UK venues for DTO products.
Increased market fragmentation does not appear to have had a direct impact on liquidity
OTC derivative markets are global in nature and very agile. Trading liquidity in OTC IRS tends to concentrate on a currency-by-currency basis; liquidity begets liquidity. However, the combination of a relatively hard Brexit for financial services, the lack of EU - UK equivalence (or a progressive, detailed financial services agreement), combined with the equivalence available from both the EU and the UK to use US SEFs, has had the effect of driving some former UK venue volume to SEFs and a number of EU venues, primarily in Amsterdam and to a lesser extent in Paris.
These shifts in market share have created a more geographically fragmented market in EUR and GBP IRS and a more geographically concentrated market in USD IRS on SEFs. IHS Markit has not performed a liquidity analysis. However, anecdotally the geographical fragmentation does not appear to have had a direct impact on liquidity.
January 2021 saw generally reduced activity, both in terms of volumes and notional traded compared to January 2020. This could be explained by low volatility, caused by a low and stable interest rate environment. However, volumes rebounded in February and to an even greater extent in March. This rebound has been primarily driven by inflation fears in the US.[x]
[i] The calculations are generally, except as otherwise stated based on (i) all new single currency interest rate swaps; Including IRS & OIS (fixed versus floating), fixed versus fixed swaps and basis swaps (floating vs floating) referencing all floating rate options (indices), supported by IHS Markit's MarkitWire platform.
[ii] The full set of EU, UK DTO and US MAT rules are complex. As a proxy for subject to a trading obligation we have used Product IRS (fixed float), Tenor DTO/MAT, Spot starting (i.e. excluded non-spot but also excluded IMM which is DTO/MAT), Roll frequency 3m or 6m and Floating Rate Option (index) DTO/MAT.
[iii] For the avoidance of doubt these are not just swaps cleared in the EU, they are swaps cleared at any of the OTC IRS clearing houses globally.
[iv] The conversion to Euro, USD and GBP use 31/3/2021 rates of GBP:EUR 1:1.1725 and EUR:USD 1:1.17235.
[v] Swaps markets are seasonal so comparing volumes between different months is misleading. For example, January is typically a month with robust trading activity, whereas December can be heavily impacted by the holiday period. To compare 'like-for-like' we looked at January, February, March each year from 2016 through to 2021.
[vi] The calculation compares market share in March 2021 versus July 2020. The percentage difference is multiplied by the number of trades in March 2021 and by the aggregate notional traded in March 2021. The conversion to EUR, USD and GBP use 31/3/2021 rates of GBP:EUR 1:1.1725 and EUR:USD 1:1.17235.
[vii] There is at least one UK-based SEF. To protect client confidentiality, the UK SEF trades have been classified as SEF rather than being classified separately. Therefore, SEF throughout the analysis means all SEFs including the US SEFs plus a(ny) UK SEF(s). To note, there are also a small quantity of US MTF/OTF trades. As these are immaterial, they have been ignored for the purposes of this analysis.
[viii] In the EU and UK this is the DTO. The US has a similar requirement called Made Available to Trade (MAT).
[ix] The full set of EU and UK DTO and US MAT rules are complex. As a proxy for subject to a trading obligation, IHS Markit has used Product IRS (fixed float), Tenor DTO/MAT, Spot starting (i.e. excluded non-spot but also excluded IMM which is DTO/MAT), Roll frequency 3m or 6m and Floating Rate Option (index) DTO/MAT.
[x] GBP IRS volumes have been strong but may also have been inflated by IBOR migration activity.
Posted 10 May 2021 by Kirston Winters, Managing Director − MarkitSERV, IHS Markit
S&P Global provides industry-leading data, software and technology platforms and managed services to tackle some of the most difficult challenges in financial markets. We help our customers better understand complicated markets, reduce risk, operate more efficiently and comply with financial regulation.
This article was published by S&P Global Market Intelligence and not by S&P Global Ratings, which is a separately managed division of S&P Global.
