Featured Topics
Featured Products
Events
S&P Global Offerings
Featured Topics
Featured Products
Events
S&P Global Offerings
Featured Topics
Featured Products
Events
S&P Global Offerings
Featured Topics
Featured Products
Events
Financial and Market intelligence
Fundamental & Alternative Datasets
Government & Defense
Banking & Capital Markets
Economy & Finance
Energy Transition & Sustainability
Technology & Innovation
Podcasts & Newsletters
Financial and Market intelligence
Fundamental & Alternative Datasets
Government & Defense
Banking & Capital Markets
Economy & Finance
Energy Transition & Sustainability
Technology & Innovation
Podcasts & Newsletters
12 Jan, 2017 | 16:15
So the holidays are over, now what? Given the popularity of toy purchases at the end of the year, now is a good time time to review the trends and factors influencing private toy companies.
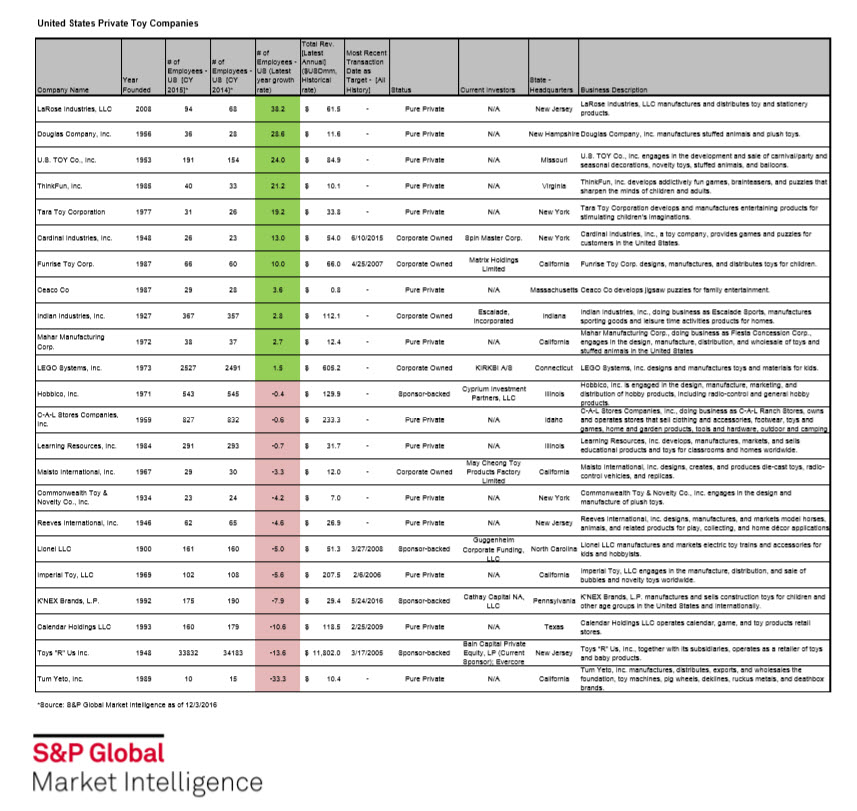
In Q4 2016, S&P Global Market Intelligence released the United States private company headcount data to the S&P Capital IQ platform, sourced from the U.S. Department of Labor 5500 forms. This stocking stuffer is something our clients are excited to use year-round. This data is the source for consistent employee metrics for companies that typically have limited disclosures in the U.S. market. In this analysis, we have outlined 23 toy companies with employee count, revenue, and latest transaction data available on the S&P Capital IQ platform. We have layered in some basic context so you can quickly see when these companies were founded, where they are located, and what type of toys they produce or manufacture.
Many of you may be familiar with the largest public toy companies, most notably Mattel and Hasbro, but below we display only U.S. private toy companies with a variable set of owners. These companies are independent and privately owned, as well as companies that are backed by private investors, or subsidiaries of corporations.
When looking at the data in the table above, we can quickly see companies with expanding and declining headcounts. The strongest performing company is LaRose Industries with employee growth of 38.2% and latest reported revenue at $61.5mm. The company with the weakest growth rate Tum Yeto at -33.3%, but we have to bear in mind they have only 10 total employees reported.
If we continue to analyze this list we can again group them by their ownership status. The first five companies in the list (LaRose Industries through Tara Toy Corporation) have double digit employee growth and are privately-held companies (e.g., no outside investors). For those that are looking at companies that currently do not have private capital investors between $10mm-$100mm these could be worth a deep dive. If you look at some of the sponsor-backed companies (Toys “R” Us and K’NEX), these are companies in a clear stage of improving their operational efficiencies, which is why they have negative employee growth rates. One can point to the closure of the Toys “R” Us flagship store in Times Square in early January 2016. Armed with an indoor 60 foot Ferris wheel, it represented the largest retail space in Manhattan (110,000 square feet). Lastly, if you look at the subsidiaries of corporations, four of the five companies in this list show varied degrees of increasing headcount over time.
This is a quick microcosm of how you can find interesting opportunities from our new private company headcount data in the S&P Capital IQ platform and Excel Plug-in. For more information, please feel free to click on the link below.
From all of us at S&P Global Market Intelligence we wish you a productive and happy 2017!

