


24 Nov 2015 | 10:31 UTC — Insight Blog
US data indicates power sector CO2 emissions down 15.6% since 2007

As it prepares for the November 30 start-up of the United Nations Climate Change conference in Paris, the US Department of Energy has been generating data that shows total US carbon dioxide emissions have declined and then flattened out in the past eight years, with emissions specifically from the US power sector part of the same trend.
The year 2007 was pivotal, according to the DOE’s Energy Information Administration. That year the US saw its CO2 emissions peak at 6 billion metric tons, which was 20% of the global total of 30 billion mt. Also that year it was reported that China produced approximately 6 billion mt of CO2.
In 2007, the US power sector emitted 2.416 billion mt of CO2, or 40% the US total. The amount of CO2 that came from burning coal was 1.987 billion mt in 2007, or 82% of total power sector emissions.
From the 2007 high until 2012, the US’s total CO2 emissions ratcheted downward.
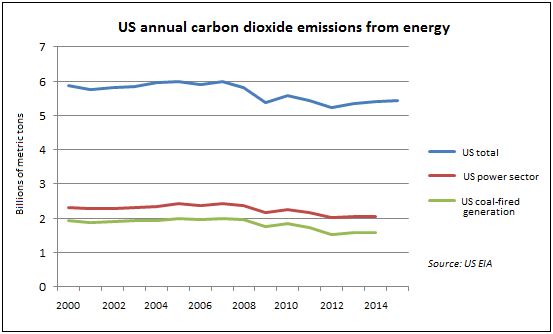
By 2012 total US CO2 emissions had fallen to the lowest level since 1994, declining to 5.226 billion mt. In five years, annual emissions had fallen 774 million mt, or 12.8%, from the 2007 level. That compared to a 15% increase it global annual output of CO2, which the European Commission said totaled 34.5 billion mt in 2012. The US’ share of the global total had fallen to 15.1% in 2012.
The five-year period of decline coincided with a financial panic and subsequent deep recession, weak power demand, the beginning of a substantial renewables build-out, and fracking and a natural gas production boom that was followed by falling natural gas prices which led to coal-to-gas switching.
By 2012 total US power sector emissions declined 387 million mt from its 2007 high. Power sector CO2 emissions were down 16% to 2.029 billion mt in 2012.
Most revealing, C02 emissions from the power sector’s use of coal fell 476 million mt to 1.511 billion mt, down 24% from its 1.987 billion mt high in 2007. CO2 emissions from burning coal declined from 82% to 74% of total power sector emissions in those five years.
Blog post continues below...
|
|
||||
| Request a free trial of: Megawatt Daily |  |
|||
 |
Megawatt Daily provides detailed coverage of power prices in major US and Canadian electricity markets, up-to-date information about solicitations and supply deals, and information about complex state and federal power regulations. | |||
 |
||||
|
|
||||
The EIA data reveals that in the three years since 2012 there was first a slight uptick in CO2 emissions and then a flattening out.
In 2013 total CO2 emissions rose 2.2% over 2012, then rose 0.9% in 2014 to total 5.405 billion mt.
US power sector emissions were flat at 2.046 billion mt in both 2013 and 2014, which represents an 0.8% increase over 2012 levels. According to a recent US DOE report, the ramp up of wind generation in 2013 reduced annual CO2 emissions by approximately 115 million mt.
Compared to 2007, power sector emissions in 2014 were down 15.6%. Emissions from burning coal rose slightly in 2013 and flattened in 2014 at 1.570 billion mt. The 2014 level of CO2 from the power sector’s burning of coal is down 21% from its high in 2007.
For the power sector, perhaps what is of greatest importance is the fact that power sector emissions were 37% of the US total CO2 emissions at the end of 2014, compared to 40.4% at the end of 2007.
Emissions projected steady in 2014
The US’ CO2 emissions for 2015 are projected by the EIA to total 5.424 billion mt, a 0.3% rise over 2014, but still one of the lowest levels in the past 16 years.
What congregants in Paris will determine is the current global emissions total is hard to know precisely, with some of the uncertainty surrounding China.
Most estimates peg China's CO2 emissions somewhere between 8 and 9 billion mt annually. However, a recent report from The New York Times raised questions about the amount of coal that China burns annually for power. The report suggested that a Chinese government agency has been under-reporting by some 17% the amount of coal burned. An error in reporting roughly 600 million mt of coal use would translate into a roughly 1 billion mt error in reported CO2 emissions.
Governmental agencies around the globe have all had their reporting inconsistencies. The International Energy Agency has said it believes 2013 global energy-related CO2 emissions was 32.2 billion mt, with China emissions representing 28% of that total, of 9.01 billion mt. The IEA has said it believes 2014 global emissions were flat at 32.2 billion mt, with the flatness due to “global economic weakness.”
The European Commission reported a “new high” of 35.3 billion mt of global CO2 emissions for the year of 2013. I would agree with the IEA in saying that the 2014 emissions total was roughly the same as that in 2013.