IN THIS LIST

SPIVA Australia Mid-Year 2022

Australian Persistence Scorecard: Year-End 2021

Canada Persistence Scorecard: Year-End 2021

U.S. Persistence Scorecard Year-End 2021

SPIVA Canada Year-End 2021

SPIVA Australia Mid-Year 2022

Contributor Image
Benedek Vörös

Director, Index Investment Strategy

S&P Dow Jones Indices

Contributor Image
Tim Edwards

Managing Director and Global Head of Index Investment Strategy

S&P Dow Jones Indices

Contributor Image
Davide Di Gioia

Director, Index Investment Strategy

S&P Dow Jones Indices

The SPIVA Australia Scorecard measures the performance of Australian actively managed funds against their respective benchmarks over various time horizons, covering large-, mid- and small-cap equity funds, real estate funds and bond funds, providing statistics on outperformance rates, survivorship rates and fund performance dispersion.

Since the first publication of the S&P Indices Versus Active Funds (SPIVA) U.S. Scorecard in 2002, S&P Dow Jones Indices has been the de facto scorekeeper of the ongoing active versus passive debate. 

Mid-Year 2022 Highlights

In the first half of 2022, outperformance was close to a coin flip for Australian Equity General funds, with 50% underperforming the S&P/ASX 200.  Over the same period, 40% of Australian Equity A-REIT funds underperformed their respective benchmarks, while a majority of funds lagged in the fixed income and small-cap equity categories.  An increasing majority of active funds underperformed in every reported category over longer-term horizons (see Exhibit 1 and Report 1).

SPIVA Australia Mid-Year 2022: Exhibit 1

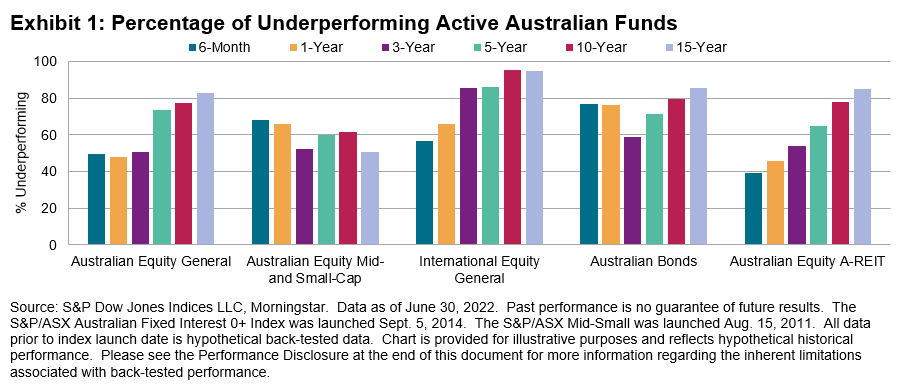
  • Australian Equity General Funds: The S&P/ASX 200 dropped 9.9% in the first six months of the year, while Australian Equity General funds shed 10.0% and 11.0% on equal and asset-weighted bases, respectively. Of funds in this category, 49.8% underperformed the benchmark over the first half of the year, with underperformance rates rising to 73.6%, 77.2% and 82.9% over the 5-, 10- and 15-year horizons, respectively.
  • Australian Equity Mid- and Small-Cap Funds: The S&P/ASX Mid-Small gave up 20.3% in the six months ending June 30, 2022, and just 31.8% of Australian Equity Mid- and Small-Cap funds beat the index, while more than 81% underperformed on a risk-adjusted basis. Funds in this category lost 24.2% and 26.0% on equal- and asset-weighted bases, respectively, for the same period.  The longer-term record within the small- and mid-cap category was relatively stronger, with just 51.0% underperforming over 15 years.
  • International Equity General Funds: International equity funds returned -17.2% and
    -16.6% on equal and asset-weighted bases in the six-month period ending on June 30, 2022, with 56.9% of funds failing to keep up with the S&P Developed Ex-Australia LargeMidCap. Over the 5- and 10-year periods, more than 85% and 95% of funds underperformed, respectively.

pdf-icon PD F Download Full Article

Australian Persistence Scorecard: Year-End 2021

Contributor Image
Priscilla Luk

Managing Director, Global Research & Design, APAC

S&P Dow Jones Indices

Contributor Image
Tim Wang

Senior Analyst, Global Research & Design

S&P Dow Jones Indices

EXECUTIVE SUMMARY

  • While comparing active funds against their respective benchmark indices is a typical practice to evaluate their performance, persistence is an additional test that can reveal fund managers’ skills in different market environments.
  • In this report, we measure the performance persistence of active funds that outperformed their peers and benchmarks over consecutive three- and five-year periods, and we analyze their transition matrices over subsequent periods.
  • Overall results suggested only a minority of Australian high-performing funds persisted in outperforming their respective benchmarks or consistently stayed in their respective top quartiles for three or five consecutive years.

  • Over the consecutive three-year period, 13.6% of funds consistently maintained top-quartile rankings and 29.4% of funds beat their benchmark consistently.
  • Over the consecutive five-year period, only 3.0% of funds consistently maintained top-quartile rankings and 4.4% of funds beat their benchmark consistently.
  • Top-quartile and outperforming Australian funds did not show strong persistence over two non-overlapping three- and five-year periods, though they tended to have lower liquidation rates.
  • Only 32% of funds maintained top-quartile rankings over two successive three-year periods and fewer (28%) did so for two successive five-year periods.

pdf-icon PD F Download Full Article

Canada Persistence Scorecard: Year-End 2021

Our widely followed SPIVA® Canada Scorecard has consistently shown that most Canadian active managers underperform their benchmarks most of the time. But, when an active manager outperforms, how do we know whether the result is a product of genuine skill or merely of good luck? One key is that genuine skill is likely to persist, while luck is random and can soon dissipate.

The Canada Persistence Scorecard attempts to distinguish luck from skill by measuring the consistency of active managers' success. Historically, persistence reports have shown that, regardless of asset class or style focus, active management outperformance is typically short lived, with few funds consistently outranking their peers. While our latest report shows some improvement in persistence, it remains the case that historical good performance is not predictive of future good performance.

For example, Exhibit 1 shows that of the 277 funds that ranked in the top half of their respective style category during 2012-2016, just 48.4% remained in the top half for 2017-2021. Meanwhile, the most likely outcome for bottom-half funds was to shut their doors for good.

Canada Persistence Scorecard Year-End 2021: Exhibit 1

There was greater evidence of persistence during more recent years and when viewed at shorter intervals. In six of the seven categories tracked, more than 25% of the funds in the top half in 2019 maintained that status in 2020 and 2021, lending some credence to the idea of fund persistence. Leading the way were Global Equity and International Equity funds, with more than 35% of funds managing that feat (see Report 1).

Similarly, there were a total of 173 funds that ranked in the top quartile for their style category in 2017. Of those 173, 5 funds (2.9%) stayed in the top quartile annually through 2021. Viewed probabilistically, this is better than the (25%)4 = 0.39% that might be expected if fund performance were purely random. As such, while the Persistence Scorecard does not prove that fund performance is completely random, from a practical or decision-making perspective, it tends to reinforce the notion that choosing between active funds on the basis of previous outperformance could be a misguided strategy. Although analysis of funds in Canada suffers from small sample sizes, this may be reinforced by the observation that these five funds were all Global Equity or U.S. Equity funds, with the other five categories displaying no top-quartile persistence (see Report 2).

Transition matrices tell a similar story. Using three-year windows, four of the seven categories show greater than 50% of top-half funds from the 2016-2018 period remaining in the top half for 2019-2021. Switching to the five-year window, only in two categories did more than 50% of funds qualify for the top half for both the 2012-2016 and 2017-2021 periods (see Reports 4 and 6).

Unsurprisingly, the one pattern that did hold across categories was the tendency of the poorest-performing funds to close. Third- and fourth-quartile funds were generally the most likely to merge or liquidate over the subsequent three- and five-year windows, led by the 55% of Canadian Focused Equity bottom-quartile funds in the 2012-2016 period that disappeared by 2021 (see Reports 3 and 5).

Style changes did not appear to be correlated with fund performance. Top, middle and bottom performers within a category generally had similar chances of style drift over the three- and five-year periods. Over a five-year period, Canadian Dividend & Income Equity funds had the highest percentage of style change (7.3%), with Canadian Small-/Mid-Cap Equity funds leading the way over the three-year period (8.1%, see Reports 3 and 5).

pdf-icon PD F Download Full Article

U.S. Persistence Scorecard Year-End 2021

SUMMARY

Should investment results be attributed to skill or luck? Genuine skill is likely to persist, while luck is random and fleeting. Thus, one measure of skill is the consistency of a fund’s performance relative to its peers or to its benchmark. The Persistence Scorecard shows that regardless of asset class or style focus, active management outperformance is typically short-lived, with few funds consistently outranking their peers or benchmarks.

Recent years illustrate this point quite well. Exhibit 1 shows that the top-quartile funds of 2019 often continued to lead the way in 2020. Had these funds developed a consistent winning strategy? Sadly, no. Even with the bull market extending into 2021, these funds quickly reverted to the mean, and only 2.2% of the 2019 domestic equity winners remained in the top quartile by 2021.

U.S. Persistence Scorecard Year-End 2021: Exhibit 1

If we extend the time horizon to five years, the picture looks still more bleak. Even selecting for the category with the highest observed persistence, just 3.5% of large-cap funds stayed in the top quartile each year. Mid-cap and small-cap funds displayed poorer persistence across all horizons, with no small-cap fund remaining in the top quartile for five years.

Some statistically minded readers might note that these numbers are occasionally better than what would be expected if fund performance were randomly distributed. For example, the odds that a top-quartile fund in one year could remain in the top quartile for the next four consecutive years might be calculated as (25%)4 = 0.39%, and the 3.5% referenced previously is substantially better than that.  While the persistence report does not prove that fund performance is completely random, from a practical or decision-making perspective, it reinforces the notion that choosing between active funds on the basis of previous outperformance is likely a misguided strategy. After all, there remains a 96.5% chance that a top-quartile fund will not stay in the top quartile consistently for the next four years.

Another way of evaluating performance persistence is by comparing performance against fund benchmarks, rather than against peer groups. Any fund alpha quickly proved fleeting viewed under this lens as well. For example, out of 791 large-cap equity funds, 232 (29.33%) beat the S&P 500® in 2019. As might be expected from the previous statistics, there was significant follow-on for 2020, with 174 of those 232 (75.0%) continuing to put up positive alpha for the next year. Fast-forward to the end of 2021, and only 21 funds (9.1%) repeated their outperformance over the benchmark.

U.S. Persistence Scorecard Year-End 2021: Exhibit 2

Unsurprisingly, the one pattern that did hold across equity funds was the tendency of the poorest-performing funds to close. Fourth-quartile funds were almost always the most likely to merge or liquidate over the subsequent three- and five-year windows, as 142 out of the 484 All Domestic Funds (29.3%) classed as bottom quartile from the December 2011–December 2016 period closed their doors within the next five years.

Fixed income funds showed results similar to equities, as strong one-year persistence soon reversed course. In 11 of the 13 categories considered, not a single top-quartile fund from 2017 maintained that status annually through 2021. Across all fixed income categories, a nearly identical 28.9% (63 out of 218 funds) of bottom-quartile funds from the December 2011-December 2016 period were consigned to the history books within five years.

pdf-icon PD F Download Full Article

SPIVA Canada Year-End 2021

The S&P/TSX Composite posted 25.1% in 2021, its best return in the past 10 years. The S&P/TSX Canadian Dividend Aristocrats® and the S&P 500® (CAD) also garnered significant returns of 26.0% and 27.6%, respectively.

In 2021, 67% of Canadian Equity funds underperformed their benchmark. Consistent with previous evidence over 10-year time frames, a majority of active managers in every fund category lagged their benchmarks, providing a compelling case for passive investing.

SPIVA Canada Year-End 2021: Exhibit 1

U.S. Equity funds were particularly notable for their level of underperformance. On an equal-weighted basis, U.S. Equity funds underperformed the S&P 500 (CAD) by 5.9% over the past year, the worst relative performance of any fund category.

U.S. Equity funds posted a 20.2% gain on an asset-weighted basis, starkly lower than the 27.6% return for the S&P 500 (CAD), the best-performing benchmark. U.S. equities have offered the best returns over the past decade, with the S&P 500 (CAD) gaining 15.1% annualized, yet active funds were unable to keep up: 90% fell short, by an average of 4% per year on an equal-weighted basis.

Canadian Dividend & Income Equity funds posted the highest returns over the past year across funds, with a 25.7% return on an asset-weighted basis. However, 65% of funds in this category still lagged their benchmark.

The smaller-cap names of the S&P/TSX Completion Index finished 2021 up 14.9%, underperforming the Canadian Small-/Mid-Cap Equity funds, as just 13% failed to beat the S&P/TSX Completion Index. Less triumphant, but recently edging closer to parity, 59% and 57% of funds in this category fell short against their benchmark over the 5- and 10-year periods, respectively.

Despite outperforming their benchmark by 1.8% for 2021, Canadian Focused Equity funds were also notable for having the worst chances of beating the index over the 10-year period, with just 6 of 128 funds (4.7%) surpassing the blended target. Only 43% of these funds survived the decade, the worst survivorship of any category.

International Equity funds did slightly worse on a relative basis over the past six months, with 67% underperforming the benchmark, up from 58% at mid-year 2021. Global Equity funds also added little credence to the track record of active management, with 83% underperforming the 20.4% gain of the S&P Developed LargeMidCap (CAD).

Taking a look through a size lens, larger funds in Canada continued to outperform their smaller counterparts as 17, down from 22 at mid-year 2021, of the 28 results showed higher asset-weighted returns across the seven fund categories and four time horizons studied.

The SPIVA Scorecards' accounting for survivorship bias continues to provide a valuable caution for asset allocators, as 40% of all funds in the eligible universe 10 years ago have since been liquidated or merged.

pdf-icon PD F Download Full Article

Processing ...