IN THIS LIST

SPIVA Canada Year-End 2022

SPIVA Canada Year-End 2021

SPIVA Japan Year-End 2021

Europe Persistence Scorecard: Year-End 2021

SPIVA® MENA Year-End 2021

SPIVA Canada Year-End 2022

Contributor Image
Anu R. Ganti

Senior Director, Index Investment Strategy

Contributor Image
Tim Edwards

Managing Director and Global Head of Index Investment Strategy

Contributor Image
Joseph Nelesen, Ph.D.

Senior Director, Index Investment Strategy

Contributor Image
Davide Di Gioia

Director, Index Investment Strategy

Since the first publication of the S&P Indices Versus Active Funds (SPIVA) U.S. Scorecard in 2002, S&P Dow Jones Indices has been the de facto scorekeeper of the ongoing active versus passive debate.

The SPIVA Canada Scorecard measures the performance of Canadian actively managed funds against their respective benchmarks over various time horizons, covering large-, mid- and small-cap segments, as well as international and global equity funds.

Year-End 2022 Highlights

2022 was a relatively less challenging year for most actively managed funds in Canada. A little over one-half of active funds underperformed their benchmarks in several categories, including Canadian Equity at 52%, Canadian Focused Equity at 63%, U.S. Equity at 58% and Global Equity at 54% (see Exhibit 1 and Report 1). Canadian Dividend & Income Equity funds posted the lowest one-year underperformance, with just 42% lagging the benchmark. Underperformance rates generally increased with time horizons.

Exhibit 1

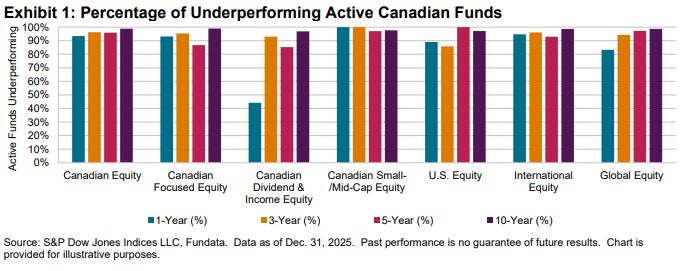
  • Canadian Equity Funds: The S&P/TSX Composite Index fell 5.8% in 2022, while Canadian Equity funds dropped 5.8% and 5.5% on equal- and asset-weighted bases, respectively. Underperformance rates hit 52% for the one-year period, climbing to 84%, 93% and 85% over the 3-, 5- and 10-year horizons, respectively.
  • Canadian Focused Equity Funds: The blended benchmark of 50% S&P/TSX Composite Index + 25% S&P 500® + 25% S&P EPAC LargeMidCap fell 8.2% in 2022, outperforming 63% of Canadian Focused Equity funds. This rose to 71%, 92% and 96% over the 3-, 5- and 10-year horizons, respectively.
  • Canadian Dividend & Income Equity Funds: The S&P/TSX Canadian Dividend Aristocrats® Index fell 3.7% during 2022, while Canadian Dividend & Income Equity funds lost 4.4% and 3.7% on equal- and asset-weighted bases, respectively. Underperformance rates reached 42% over the one-year period, rising to 57%, 88% and 72% over the 3-, 5- and 10-year horizons, respectively.
  • Canadian Small-/Mid-Cap Equity Funds: The S&P/TSX Completion Index dipped 4.2% in 2022, and 90% of Canadian Equity Small-Mid-Cap funds underperformed the index. Funds in this category lost 11.5% and 11.4% on equal- and asset-weighted bases, respectively, over the one-year period.
  • U.S. Equity Funds: The S&P 500 shed 12.2% in 2022, and 58% of U.S. Equity funds underperformed the index. Few funds in the U.S. Equity category outperformed over the long term, with 94%, 96% and 98% underperforming over 3-, 5- and 10-year horizons, respectively.
  • International Equity Funds: 69% of International Equity funds trailed the S&P EPAC LargeMidCap, and 84% and 93% underperformed over the 5- and 10-year periods, respectively.
  • Global Equity Funds: The S&P Developed LargeMidCap fell 12.3% in 2022 and Global Equity funds sank 14.7% and 14.4% on equal- and asset-weighted bases, respectively. Over the one-year period, 54% of funds in the category trailed the benchmark.  Over the 3-, 5- and 10-year periods, 93%, 94% and 97% of funds underperformed, respectively.
  • Fund Survivorship: Liquidation rates for all categories were in single digits for the one-year period ending Dec. 30, 2022. Over the 10-year period, 45% of Canadian Equity funds merged or liquidated and 37% of funds disappeared across all categories (see Report 2).

pdf-icon PD F Download Full Article

SPIVA Canada Year-End 2021

Contributor Image
Berlinda Liu

Director, Multi-Asset Indices

The S&P/TSX Composite posted 25.1% in 2021, its best return in the past 10 years. The S&P/TSX Canadian Dividend Aristocrats® and the S&P 500® (CAD) also garnered significant returns of 26.0% and 27.6%, respectively.

In 2021, 67% of Canadian Equity funds underperformed their benchmark. Consistent with previous evidence over 10-year time frames, a majority of active managers in every fund category lagged their benchmarks, providing a compelling case for passive investing.

Exhibit 1

U.S. Equity funds were particularly notable for their level of underperformance. On an equal-weighted basis, U.S. Equity funds underperformed the S&P 500 (CAD) by 5.9% over the past year, the worst relative performance of any fund category.

U.S. Equity funds posted a 20.2% gain on an asset-weighted basis, starkly lower than the 27.6% return for the S&P 500 (CAD), the best-performing benchmark. U.S. equities have offered the best returns over the past decade, with the S&P 500 (CAD) gaining 15.1% annualized, yet active funds were unable to keep up: 90% fell short, by an average of 4% per year on an equal-weighted basis.

Canadian Dividend & Income Equity funds posted the highest returns over the past year across funds, with a 25.7% return on an asset-weighted basis. However, 65% of funds in this category still lagged their benchmark.

The smaller-cap names of the S&P/TSX Completion Index finished 2021 up 14.9%, underperforming the Canadian Small-/Mid-Cap Equity funds, as just 13% failed to beat the S&P/TSX Completion Index. Less triumphant, but recently edging closer to parity, 59% and 57% of funds in this category fell short against their benchmark over the 5- and 10-year periods, respectively.

Despite outperforming their benchmark by 1.8% for 2021, Canadian Focused Equity funds were also notable for having the worst chances of beating the index over the 10-year period, with just 6 of 128 funds (4.7%) surpassing the blended target. Only 43% of these funds survived the decade, the worst survivorship of any category.

International Equity funds did slightly worse on a relative basis over the past six months, with 67% underperforming the benchmark, up from 58% at mid-year 2021. Global Equity funds also added little credence to the track record of active management, with 83% underperforming the 20.4% gain of the S&P Developed LargeMidCap (CAD).

Taking a look through a size lens, larger funds in Canada continued to outperform their smaller counterparts as 17, down from 22 at mid-year 2021, of the 28 results showed higher asset-weighted returns across the seven fund categories and four time horizons studied.

The SPIVA Scorecards' accounting for survivorship bias continues to provide a valuable caution for asset allocators, as 40% of all funds in the eligible universe 10 years ago have since been liquidated or merged.

pdf-icon PD F Download Full Article

SPIVA Japan Year-End 2021

Contributor Image
Priscilla Luk

Managing Director, Global Research & Design, APAC

Contributor Image
Tim Wang

Senior Analyst, Global Research & Design

SUMMARY

  • S&P Dow Jones Indices has been the de facto scorekeeper of the ongoing active versus passive debate since the first publication of the SPIVA U.S. Scorecard in 2002. Over the years, we have built upon our experience by expanding scorecard coverage into Australia, Canada, Europe, India, South Africa, Latin America, the Middle East and North Africa, and Japan.  While this report will not end the debate surrounding active versus passive investing in Japan, we hope to make a meaningful contribution by examining market segments in which one strategy performs better than the other.
  • The SPIVA Japan Scorecard reports on the performance of actively managed Japanese mutual funds against their respective benchmark indices over 1-, 3-, 5-, and 10-year investment horizons. In this scorecard, we evaluated the returns of more than 774 Japanese large- and mid-/small-cap equity funds, more than 818 international equity funds investing in global, international, and emerging markets, as well as U.S. equities.
  • Japanese Equity Funds: In 2021, the S&P/TOPIX 150 and the S&P Japan MidSmallCap gained 7% and 8.8%, respectively. Over the same period, 64.7% and 55.8% of large- and mid-/small-cap equity funds underperformed their respective benchmarks, with equal-weighted average returns of 13.0% and 7.8%, respectively. Active domestic equity fund performance relative to the benchmark in 2021 was worse than in 2020, with much higher percentages of funds underperforming the benchmark.

Over the 10-year horizon, 18.1% and 52.8% of large- and mid-/small-cap funds managed to outperform their benchmarks, while 38.3% and 33.5% were liquidated, respectively.  The equal- and asset-weighted average returns of Japanese large-cap funds lagged the benchmark by 0.46% and 0.44%, respectively, while the mid-/small-cap funds reported annualized excess returns of 3.3% and 1.2% on equal- and asset-weighted bases, respectively.  Japanese mid-/small-cap funds tended to deliver higher benchmark-relative excess return compared with Japanese large-cap funds across different periods.

  • Foreign Equity Funds: In 2021, more active funds underperformed their benchmarks than in 2020 across all foreign equity fund categories. More than 80% of U.S., global, and international equity funds underperformed their respective benchmarks, and 68.8% of emerging equity funds lagged the S&P Emerging BMI.  For 2021, all foreign equity fund categories recorded worse average return than their respective benchmark indices.  In particular, the equal-weighted and asset-weighted average return of global equity funds lagged the S&P Global 1200® by 11.1% and 20.6% respectively.

Over the 10-year period, the vast majority of foreign equity funds did not outperform their respective benchmarks.  Less than 10% of global, international, and emerging equity funds outperformed their respective benchmarks, while only 17.2% of U.S. equity funds beat the S&P 500®.  However, U.S. equity funds underperformed most in their benchmark-relative returns, with annualized excess returns of -6.2% and -5.9% on equal- and asset-weighted bases, respectively.  Foreign equity funds had a 10-year liquidation rate of 50.2%, which was much higher than that of domestic equity funds (36.5%).

Exhibit 1: Percentage of Funds Outperformed by the Index in Annual Figures (Based on Absolute Return)

pdf-icon PD F Download Full Article

Europe Persistence Scorecard: Year-End 2021

Contributor Image
Andrew Cairns

Director, Global Research & Design

Contributor Image
Andrew Innes

Head of EMEA, Global Research & Design

INTRODUCTION

The Europe Persistence Scorecard aims to differentiate skill from luck by examining the ability of active European equity funds to consistently outperform their peers and their benchmark.  This scorecard looks to support the well-known disclaimer that past performance is not indicative of future results and that oftentimes an investor may have better success in selecting a fund at random rather than from a group of top performers.

In this report, we pose two questions: did top funds stay ahead of the pack, and did outperforming funds continue to beat their benchmark?

YEAR-END 2021 HIGHLIGHTS

Pan-European Equity Funds: Looking at the two-year period since the COVID-19 pandemic started, 52% of the top-quartile Europe Equity funds at the start of 2020 were able to remain in the same category by the end of the same year.  By the end of 2021, over 21% of these same starting funds were still in the top quartile.  This figure is far higher than what would be expected through choosing a fund at random (6.25%).  This short-term persistence was not unique to Europe Equity over this period; across all fund categories, at least 6.25% of funds remained in the top quartile for three consecutive years.

While top-quartile funds may have demonstrated a better chance of repeating their relative success over this most recent period, it seems that may not have necessarily translated to outperformance when compared with their benchmarks.  To avoid the risk of drawing conclusions from a single time period, Report 8 analyzes the persistence of outperformance on average over rolling quarters.  Europe Equity funds that had beaten the benchmark in any rolling three-year window over the period analyzed had a 44.4% probability of outperforming in the subsequent year.  The probability of the same funds outperforming for three consecutive years following their initial success dropped to 7.2%.

Report 5 indicates that there may also have been some predictability when it comes to bottom-quartile funds; the report shows that 62% of Europe Equity funds in the bottom quartile either remained there or ceased to exist over the subsequent five years.  In fact, in all fund categories, fourth-quartile active funds were more likely to remain relatively poor performers, with fewer than 10% able to turn their fortunes around and become first-quartile funds.

pdf-icon PD F Download Full Article

SPIVA® MENA Year-End 2021

Contributor Image
Andrew Cairns

Director, Global Research & Design

Contributor Image
Andrew Innes

Head of EMEA, Global Research & Design

S&P Dow Jones Indices has been the de facto scorekeeper of the ongoing active versus passive debate since the first publication of the S&P Indices Versus Active Funds (SPIVA) U.S. Scorecard in 2002.  The SPIVA MENA Scorecard measures the performance of actively managed MENA equity funds denominated in local currencies against the performance of their respective S&P DJI benchmark indices over 1-, 3-, 5-, and 10-year investment horizons.

YEAR-END 2021 HIGHLIGHTS

In 2021, the MENA equity market displayed a remarkable recovery following the returns of 2020, which were heavily affected by the global COVID-19 pandemic. Of the equity benchmarks covered in this scorecard, all four posted returns in excess of 30% for the one-year period. Equity funds followed suit, albeit at a lower level, with each of the corresponding fund categories seeing asset-weighted returns in excess of 20% during the same period. Even funds at the lower end of the spectrum were able to post strong returns—the 25th percentile fund in each category had returns in excess of 25% for the one-year period.

MENA 

  • 85.2% of MENA Equity funds were outperformed by the S&P Pan Arab Composite LargeMidCap Index during the one-year period. 
  • The 75th percentile of MENA Equity funds returned 2.7% less than the benchmark over the one-year period, highlighting that even above average fund managers struggled to keep pace with the benchmark. 
  • On an asset-weighted basis, MENA Equity funds were outperformed by 5.4% and 8.6% over the one-year period by the S&P Pan Arab Composite and S&P Pan Arab Composite LargeMidCap Index, respectively. 
  • Over the one-year period, 74% of MENA Equity funds underperformed the S&P Pan Arab Composite LargeMidCap Index on a risk-adjusted basis. 

GCC

  • GCC Equity fund managers struggled to beat the benchmark during the one-year period. In 2021, 84.6% of funds had a lower return than the S&P GCC Composite, and on an asset-weighted basis, these funds collectively underperformed by a significant 13%. 
  • Over the three-year period, GCC Equity funds underperformed the benchmark by an annualized 5.8%. The underperformance cannot easily be explained away by risk, as over the same period, GCC Equity funds had a lower return-to-volatility ratio, indicating that for each unit of risk, the benchmark had higher returns (see Report 4). 

Saudi Arabia

  • Over the one-year period, 89.5% of Saudi Arabi Equity funds were outperformed by their benchmark, the S&P Saudi Arabia. For the same period, 73.7% of funds underperformed on a risk-adjusted basis. 
  • Despite posting strong one-year fund returns, even the 75th percentile of Saudi Arabia Equity funds trailed the benchmark by 2% by year-end 2021. 
  • Over the 3- and 10-year period, the outlook was slightly better for Saudi Arabia Equity funds; on an asset-weighted basis, they managed to outperform the S&P Saudi Arabia by 2.2% and 1.3% annualized, respectively. In addition, they also posted a better return-to-volatility ratio, showing they were collectively better than the benchmark even when adjusted for risk. 

pdf-icon PD F Download Full Article

Processing ...