
Summary
Should investment results be attributed to skill or luck? Genuine skill is more likely to persist, while luck is random and fleeting. The Persistence Scorecard measures the consistency of relative performance among actively managed funds and shows that, regardless of asset class or style focus, outperformance is frequently short lived, with few funds consistently outranking their peers or their benchmarks.
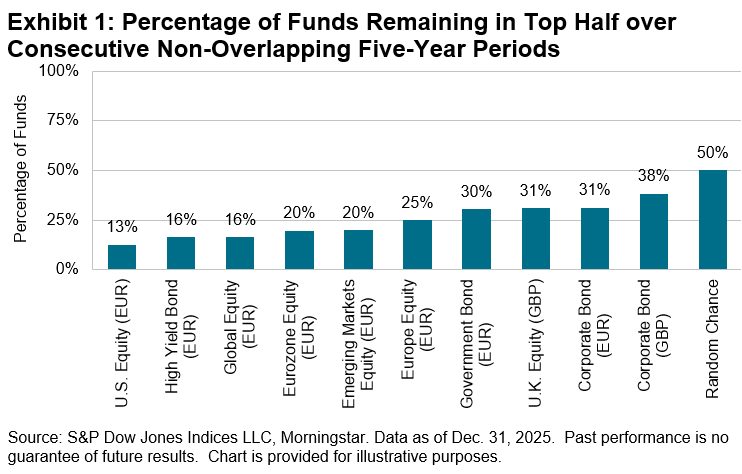
For example, just 16% of the 408 funds whose five-year performance placed them in the top half of the Global Equity category at the end of 2020 remained in the top half over the subsequent five-year period. Exhibit 1 illustrates this proportion and the equivalent for nine additional categories examined in this Scorecard. In no category did more than half of funds repeat top-half status (compared to 50% expected by chance).
Report Highlights
There was no strong evidence for persistence in relative performance in any of the fund categories or time horizons examined in this report. There was, however, some evidence of persistence beyond what would be expected purely by chance, particularly in top-half annual rankings over the past few years. As Exhibit 2 shows, the proportion of funds boasting top-half performance five years in a row to the end of 2025 was higher than a random distribution would suggest. Using cross-category weighted averages across fixed income and equities, the exhibit shows the proportion of funds in the top half in 2021 that maintained their winning record for various subsequent years. Over every horizon, significantly more funds maintained a winning track record than would be expected by chance.
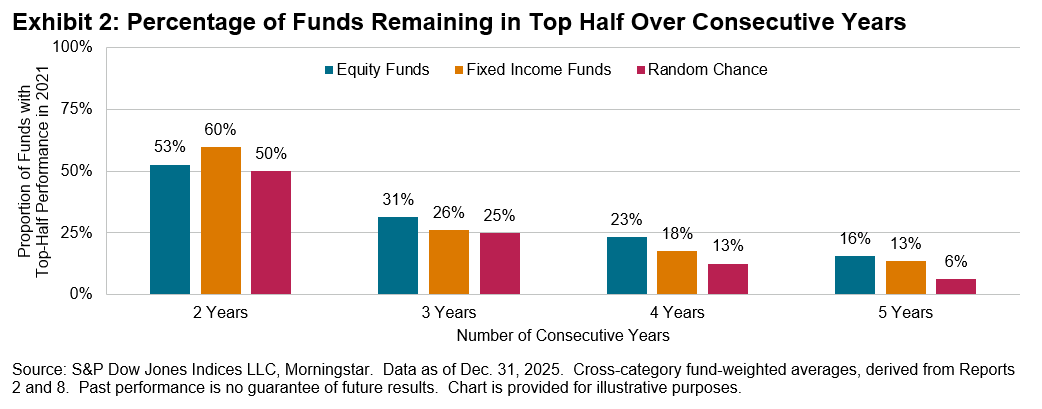
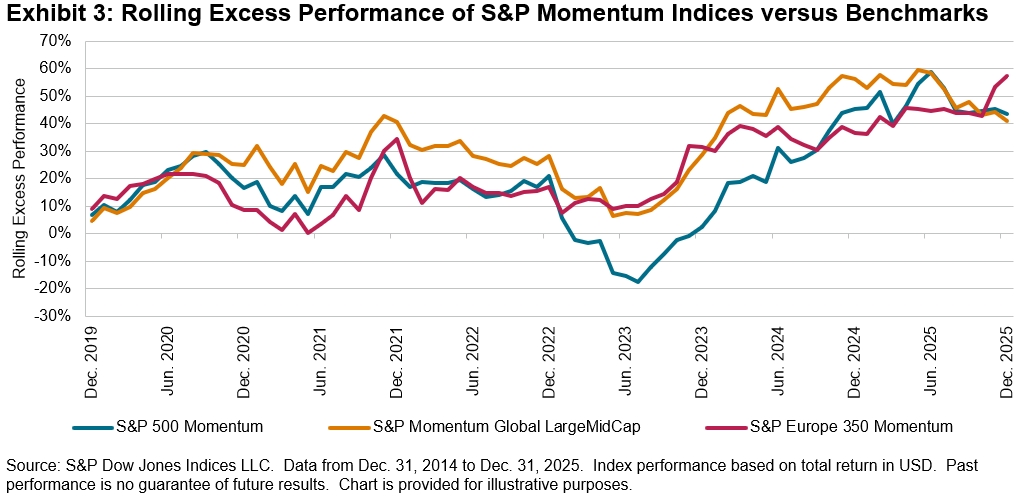
Exhibit 2 shows stronger relative fund performance persistence in equity categories than in fixed income categories, which may be partly a consequence of the performance trends that have been visible within the underlying equity markets over the past five years. Offering context, Exhibit 3 plots the rolling five-year excess performance of selected S&P Momentum Indices, which reflect the performance of stocks that exhibit persistence in their relative performance. The excess performance is measured against their respective benchmarks.
Across the S&P Global LargeMidCap, S&P 500® and S&P Europe 350®, the excess performance of momentum was strongly positive over recent five-year periods. If previously winning securities, sectors or styles continued to outperform, perhaps the managers that favored them were more likely to outperform too.