

Summary
The SPIVA Latin America Scorecard measures the performance of actively managed funds across Brazil, Chile and Mexico against their respective benchmarks over various time horizons, providing statistics on underperformance rates, survivorship rates and fund performance dispersion.
Mid-Year Highlights
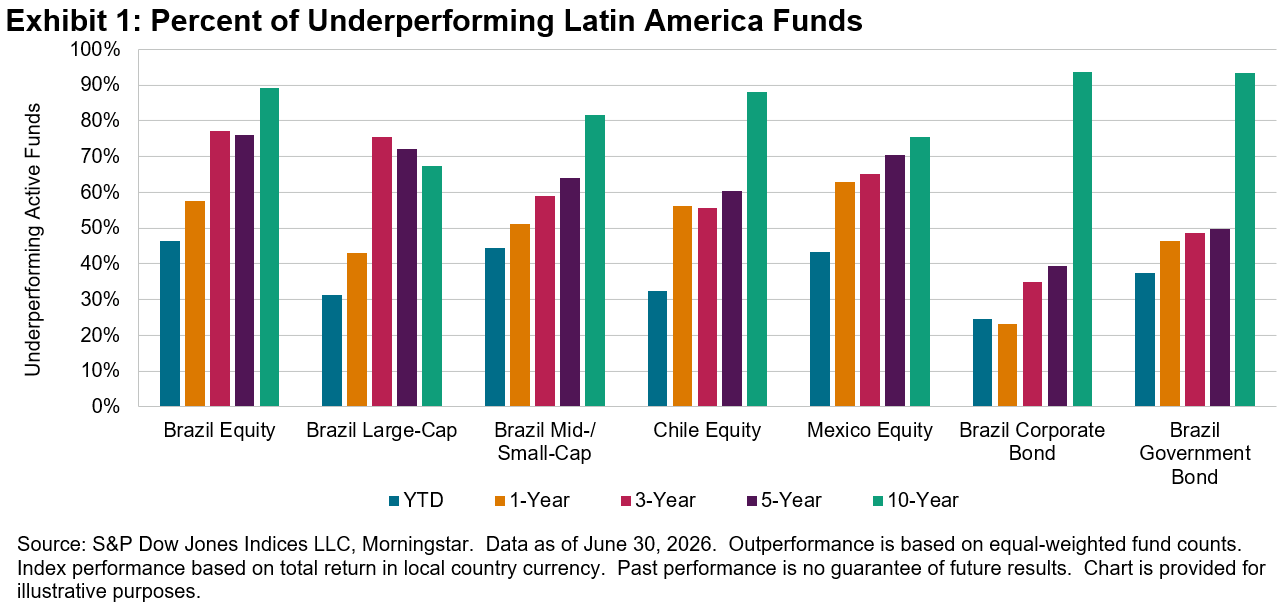
Most Latin American benchmarks rose during H1 2026, and amid heightened dispersion and volatility, fewer than half of active funds lagged their benchmarks, with H1 underperformance rates ranging from 24.5% to 46.3%. Despite recent success, most funds underperformed in every category over 10 years (see Exhibit 1).
Mexico
- The S&P/BMV IRT climbed 5.8% in the first half of 2026. Less than half of active Mexico Equity funds (43.5%) underperformed for the six-month horizon. While a significant 63.0% of funds underperformed over the one-year period, this figure steadily rose to 65.1%, 70.5% and ultimately 75.6% over the 3-, 5- and 10-year periods, respectively (see Report 1a).
- The median active fund return beat the benchmark by 0.9% in H1 2025 and underperformed by 1.1%, 0.7%, 1.3% and 2.8% for the 1-, 3-, 5- and 10-year periods, respectively (see Reports 3 and 5). Over the 10-year period, the threshold for top-quartile managers exceeded the benchmark by 0.5%.
- Survival rates for active Mexico Equity funds remained the highest among all domestic equity categories in our SPIVA Latin America Scorecard, at 100%, 97.8%, 97.7% 95.5% and 82.9% over the 6-month and 1-, 3-, 5- and 10-year periods, respectively (see Report 2).
- Funds in Mexico with greater assets, on average, performed slightly worse than smaller funds in H1 2026. During the first six months of 2026, average returns for Mexico Equity funds were 3.7% and 5.5% on asset-weighted and equal-weighted bases, respectively (see Reports 3 and 4).
Brazil
- Brazil’s equity market finished the first half of 2026 with mixed results. Large-cap stocks, as measured by the S&P Brazil LargeCap, led the way, rising 3.0% in H1. In aggregate, smaller stocks were a drag on performance, as illustrated by the S&P Brazil BMI climbing 1.6% while the S&P Brazil MidSmallCap declined 1.5% during the first six months of 2026.
- Year-to-date through June 2026, active fund underperformance varied across Brazilian equity categories. While 31.2% of Brazil Large-Cap funds trailed their benchmark, underperformance was higher for Brazil Mid-/Small-Cap funds and broader Brazil Equity funds at 44.5% and 46.3%, respectively. Active managers within all categories produced even worse outcomes relative to their respective benchmarks over the longer 10-year period ending in June 2026, with underperformance rates of 67.4%, 89.2% and 81.7% in the Brazil Large-Cap, Brazil Equity and Brazil Mid-/Small-Cap fund categories, respectively (see Report 1a).
Chile
- Chile’s equity market remained positive for the first half of 2026, with the S&P Chile BMI rising 3.4% (see Report 3).
- Slightly less than one-third of active Chile Equity funds (32.5%) underperformed the S&P Chile BMI over the first six months of 2026, but underperformance rates varied over longer time periods, with 56.1%, 55.6%, 60.5% and 88.1% of active funds lagging the benchmark over the 1-, 3-, 5- and 10-year periods, respectively (see Report 1a). The median Chile Equity fund outperformed the benchmark by 1.1% in H1 2026 but trailed by 1.4% over the longer 10-year period (see Report 5).
- Over the six-month period, the average relationship between fund size and returns was inverse, with active Chile Equity funds rising 12.5% and 4.7% on equal-weighted and asset-weighted bases, respectively. Over the 10-year period ending in June 2026, however, returns for Chile Equity funds remained somewhat similar across asset levels, averaging 12.1% on an equal-weighted basis, while asset-weighted returns averaged 11.5% (see Reports 3 and 4).
- Over the 10-year period, the threshold for top-quartile active funds exceeded the benchmark by 1.0% (see Reports 3 and 5).
Fixed Income
- Brazil’s bond benchmarks continued to rise in H1, with the ANBIMA IDA (corporate bonds) and ANBIMA IMA (government bonds) indices increasing 4.4% and 5.8%, respectively (see Report 3).
- Most fixed income funds outperformed in H1 2026, with six-month underperformance rates for Brazil Corporate Bond funds and Brazil Government Bond funds at 24.5% and 37.6%, respectively. Over the 10-year period, underperformance rates remained high, reaching 93.6% for Brazil Corporate Bond funds and 93.4% for Brazil Government Bond funds.
Market Context
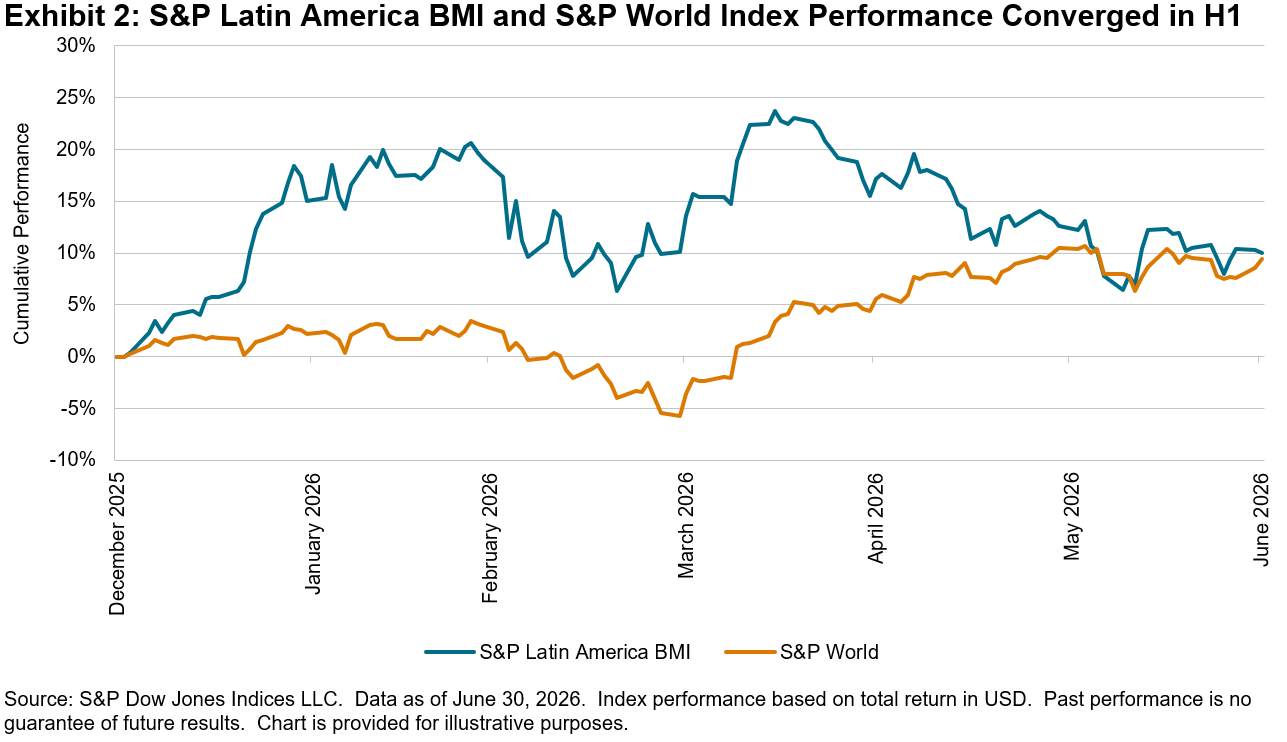
After outpacing much of the rest of the world in 2025, Latin America’s equity markets remained in positive territory during the first half of 2026, but not without some bumps along the way. The S&P Latin America BMI entered the year strong, outpacing the S&P World Index and quickly rising more than 20% before eventually slowing down to finish H1 up 10.0% in U.S. dollar terms (see Exhibit 2).