


Summary
Can investment results be attributed to skill or luck? Genuine skill is more likely to persist, while luck is random and fleeting. Thus, one measure of skill is the consistency of a fund's performance relative to its peers. The Persistence Scorecard measures that consistency and shows that, regardless of asset class or style focus, active management outperformance tends to be relatively short lived, with few funds consistently outranking their peers.
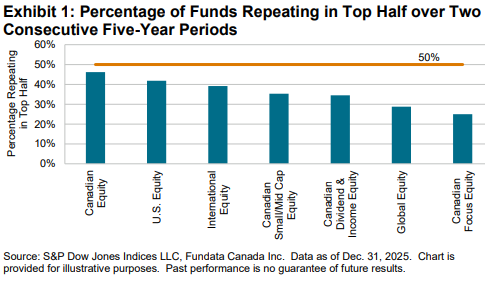
Among the 169 funds in seven categories that placed in the top quartile for the 12-month period ending December 2021, only one managed to remain in the top quartile for each of the next four years (see Report 2). We also found that in all seven fund categories, the percentage of Canada-domiciled actively managed equity funds staying in the top half over two consecutive five-year periods fell below what would be expected from a random distribution (see Exhibit 1 and Report 6).
Report Highlights
In 2025 there were continued challenges for Canadian active funds, with 93.4% of Canadian Equity funds underperforming the S&P/TSX Composite Index. In addition, sustaining top-tier performance proved to be a significant challenge, as observed from the following statistics on how Canadian funds performed relative to their peers.
- In five out of seven fund categories, more managers remained in the top quartile for three consecutive years than the expected rate of 6.25% based on random chance (see Report 1). Equity funds focused outside of Canada fared best. Among top-quartile funds from the U.S Equity, International Equity and Global Equity categories at the end of 2023, managers remained in the top quartile over two successive years at rates of 22.9%, 22.2% and 17.2%, respectively. In contrast, zero funds in the Canadian Equity and Canadian Small-/Mid-Cap Equity categories achieved the same outcome.
- Over a five-year period, from the set of all Canadian-domiciled active funds that ranked in the top quartile in their respective categories at the end of December 2020, only one fund, in the Global Equity category, managed to maintain that position over the subsequent four years (see Report 2).
- In all seven categories (Canadian Equity, Canadian Small-/Mid-Cap Equity, Canadian Focused Equity, Canadian Dividend & Income Equity, U.S. Equity, Global Equity and International Equity), one-fourth of funds or fewer remained in the top quartile for two consecutive five-year periods, failing to exceed the 25.0% that would be expected under a random distribution (see Report 5).
- Over two consecutive five-year periods, 10.0% of all the top-half active equity funds across categories were merged or liquidated. Meanwhile, among the bottom half of all categories, 25.3% of funds were subsequently merged or closed (see Report 6).
