







Featured Topics
Featured Products






Events
Our Services




Investment Themes
Explore new territories with greater confidence








Equity
Fixed Income
Commodities
Multi-Asset
Sustainability
Dividends & Factors
Thematics
Our Exchange Relationships
S&P DJI combines global reach with local expertise, working with exchanges around the world to build indices for both the local and international investment communities.








Education



SPIVA®
For over 20 years, our renowned SPIVA research has measured actively managed funds against their index benchmarks worldwide.
Events & Webinars
Register to attend complimentary webinars and deepen your knowledge of current trends and issues impacting the index universe today.



Governance
Methodologies



Our Services
Professional Resources
Equity
Fixed Income
Commodities
Multi-Asset
Private Markets
Sustainability
Dividends & Factors
Thematics
Digital Assets
Indicators
Other Strategies
By Region
Our Exchange Relationships
S&P DJI combines global reach with local expertise, working with exchanges around the world to build indices for both the local and international investment communities.
Research & Insights
Education
Performance Reports
SPIVA®
For over 20 years, our renowned SPIVA research has measured actively managed funds against their index benchmarks worldwide.
Events & Webinars
Register to attend complimentary webinars and deepen your knowledge of current trends and issues impacting the index universe today.
Methodologies
SPICE
Your Gateway to Index Data
S&P Global Offerings
Featured Topics
Featured Products
Events

“A person watching the tide coming in, and who wishes to know the spot which marks the high tide, sets a stick in the sand at the points reached by the incoming waves until the stick reaches a position to where the waves do not come up to it, and finally recede enough to show that the tide has turned. This method holds good in watching and determining the flood tide of the stock market. The average of [stock prices] is the peg which marks the height of the waves. The price-waves, like those of the sea, do not recede all at once from the top. The force which moves them checks the inflow gradually, and time elapses before it can be told with certainty whether high tide has been seen or not.”
— Charles Dow, creator of the Dow Jones Industrial Average, in the January 31, 1901, edition of The Wall Street JournalThe Dow Jones Industrial Average® (The Dow) has been determining the flood tide of the market for over 130 years. Created as a simple gauge of stock market performance, this financial and cultural icon has weathered recessions, depressions, bubbles, and expansions through 23 U.S. presidencies, two world wars, and two global pandemics. Through it all The Dow has steadfastly tracked the ups and downs of the U.S. market and by extension, served as a leading indicator of U.S. and global economic health. Quoted far and wide from Wall Street to Main Street, The Dow is still the number that most investors cite when asked how the market is doing.




How Well Do You Know The Dow?
Before creating the Dow Jones Industrial Average, what was Charles Dow’s profession?
A. Railroad executive
B. Industrial manufacturer
C. Journalist
D. Stockbroker
Before creating the Dow Jones Industrial Average, what was Charles Dow’s profession?
C. Journalist
Charles Dow was a journalist, not a financier. He was born in Sterling, Connecticut, in 1851, going on to cofound Dow Jones & Co. and later The Wall Street Journal. In 1884, he introduced his first stock average in a newsletter carried by runners to subscribers on Wall Street, and in 1896 he created the Dow Jones Industrial Average. His aim was to give readers a simple, understandable way to follow broad market trends.
Which event helped turn The Dow from a Wall Street measure into a broader public market barometer?
A. The launch of The Wall Street Journal in 1889
B. The expansion to 30 stocks in 1928
C. The crash of 1929
D. The first close above 1,000 in 1972
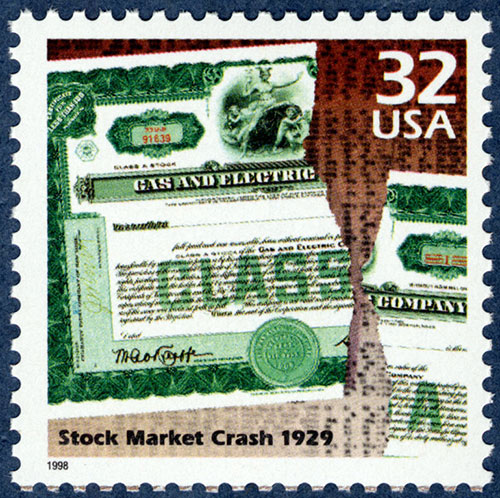
Which event helped turn The Dow from a Wall Street measure into a broader public market barometer?
C. The crash of 1929
In its early years, The Dow had limited prominence outside Wall Street. But after the crash of 1929, when the index lost nearly 30% of its value over two days, investors became more focused on following general market conditions rather than just individual stocks. That was a key moment in The Dow’s rise as a widely watched market barometer.
During which market crisis did The Dow fall back to nearly its original 1896 launch level?
A. The Panic of 1907
B. The Great Depression
C. The 1973-1974 bear market
D. The 2008 Global Financial Crisis
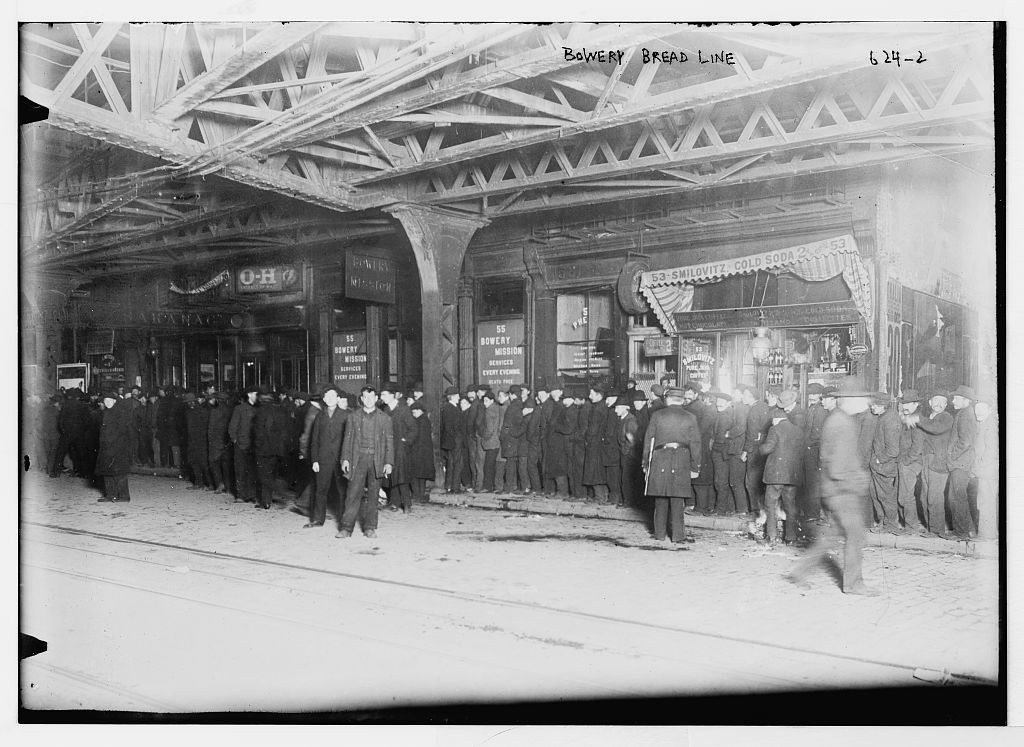
During which market crisis did The Dow fall back to nearly its original 1896 launch level?
B. The Great Depression
During the depths of the Great Depression in 1932, the DJIA hit a low of 41.22, nearly the level at which it was launched 36 years earlier at 40.94. That episode remains one of the clearest reminders that The Dow’s long history spans not only periods of growth, but also some of the most severe market downturns in U.S. history.
The DJIA has always had 30 constituents.
A. True
B. False
The DJIA has always had 30 constituents.
B. False
The DJIA initially contained 12 stocks, expanded to 20 stocks in 1916 and increased to the now familiar stock count of 30 in 1928.
These changes have impacted the constituents’ average tenure. Index constituents are reviewed monthly for ongoing eligibility.
How are DJIA constituent weightings assigned?
A. Equal weighting
B. Float-market-cap weighting
C. Price weighting

How are DJIA constituent weightings assigned?
C. Price weighting
The DJIA is a price-weighted index. Since the index is price weighted, the Index Committee evaluates stock price when considering a company for inclusion. The Index Committee also monitors whether the highest-priced stock in the index has a price more than 10 times that of the lowest. Because the DJIA is price weighted, the ratio of price-to-weight is the same for every stock.
The Utilities sector is represented in the DJIA.
A. True
B. False
The Utilities sector is represented in the DJIA.
B. False
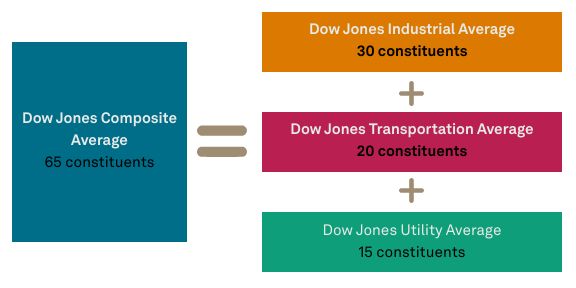
The DJIA has a 0% weight in the Utilities sector. This sector is carved out to form a separate, complementary index called the Dow Jones Utility Average. The Transportation GICS® industry group is also carved out to form the Dow Jones Transportation Average. The full group of Dow Jones Average indices are outlined as follows.
Which sector saw the largest increase in weight in the DJIA between 2012 and 2025?
A. Financials
B. Health Care
C. Industrials
D. Information Technology

Which sector saw the largest increase in weight in the DJIA between 2012 and 2025?
A. Financials
Financials saw the largest increase in weight in this dataset, rising from about 10.8% in 2012 to 28.3% in 2025.
After taking 76 years to first close above 1,000, roughly how long did it take The Dow to go from 1,000 to 10,000?
A. About 10 years
B. About 20 years
C. About 27 years
D. About 40 years
After taking 76 years to first close above 1,000, roughly how long did it take The Dow to go from 1,000 to 10,000?
C. About 27 years
The Dow first closed above 1,000 in November 1972 and crossed 10,000 in March 1999—roughly 27 years later. A journey that once took 76 years was compressed into just over a quarter-century, a direct reflection of how compounding economic growth accelerates over time.
Why it matters: Only a benchmark with 130 years of continuous live history can show the full arc of that acceleration—from the painstaking grind of the early decades to the faster cadence of milestones in the modern era. No reconstructed or back-filled series can replicate that progression in real time.
Outside the U.S., from which region do DJIA companies derive the largest share of revenue?
A. Europe
B. Latin America
C. Middle East and Africa
D. Asia-Pacific
Outside the U.S., from which region do DJIA companies derive the largest share of revenue?
D. Asia-Pacific
Outside the U.S., DJIA companies derive the largest share of revenue from the Asia-Pacific region, underscoring that the index’s relevance to the region is not just about market sentiment, but also about reflecting underlying business activity in the region.
About how large is the total ecosystem of financial products linked to the Dow Jones Industrial Average?
A. Around USD 10 billion
B. Around USD 50 billion
C. Around USD 100 billion
D. Around USD 1 trillion
About how large is the total ecosystem of financial products linked to the Dow Jones Industrial Average?
C. Around USD 100 billion
The Dow serves as the foundation for a wide range of financial products such as exchange-traded funds (ETFs), exchange-traded derivatives (ETDs) and mutual funds. Altogether, these products represent a combined value of approximately USD 113.4 billion.
The 500® and The Dow use the same weighting method.
A. True
B. False
The 500® and The Dow use the same weighting method.
B. False
This is one of the most important structural differences between the two indices. The 500 weights companies by float-adjusted market capitalization, while The Dow weights them by stock price. That means the two indices can hold many of the same large-cap companies but still reflect the market differently.
Because The Dow only tracks 30 stocks, it is a poor indicator of overall U.S. market performance.
A. True
B. False
Because The Dow only tracks 30 stocks, it is a poor indicator of overall U.S. market performance.
B. False
Despite tracking only 30 companies, The Dow has performed similarly to the far broader S&P 500 over the long term. Between Dec. 31, 1977, and Nov. 30, 2023, The Dow had an annualized price return of 8.93%—while the S&P 500 had a nearly identical 8.90% annualized price return. The reason is straightforward: The Dow's 30 components are not a random sample—they are among the largest, most economically influential companies in the U.S. economy, selected by a committee specifically to reflect the breadth of industry in the U.S. Breadth of constituent count and representativeness of market performance are not the same thing.
The Dow launched on May 26, 1896—the same year as which other iconic institution?
A. The Nobel Prize
B. The modern Olympic Games
C. The World Series
D. The Tour de France
The Dow launched on May 26, 1896—the same year as which other iconic institution?
B. The modern Olympic Games
The first games of the modern era were held in Athens from April 6–15, 1896—just six weeks before The Dow was launched. Both institutions were launched in 1896 and both are still going strong 130 years later.
Creating an Icon
The Dow Jones Industrial Average made its debut on May 26, 1896. It was the brainchild of Charles Dow, the tall, bearded, and unassuming journalist who cofounded Dow Jones & Co., publisher of The Wall Street Journal. Dow’s partner, Edward Jones, also has his name attached to the average, but he had nothing to do with its creation.
The Dow was initially made up of 12 stocks (versus 30 today), including a leather-maker, a steel provider, and a sugar producer. It was calculated by adding up the prices of the component stocks and dividing the sum by a divisor.
Going off the Rails
The Dow Jones Industrial Average wasn’t Mr. Dow’s first foray into measuring the market. In 1884 he produced an average of 11 stocks, mainly railroad companies. This market indicator was intermittently published in the “Customer’s Afternoon Letter,” a precursor to The Wall Street Journal.
But Dow believed that the rails only presented a partial picture of the economy and that industrial companies—whose stocks were considered highly speculative at the time—were crucial contributors to America’s growth. Since the goods produced by the industrials were being delivered by the railroads, Dow reasoned that two separate measures could confirm broad market trends. The Wall Street Journal began publishing the industrial average and the railroad average in every issue and has done so ever since. (With airplanes and trucks bringing competition to the railroads, the components of the railroad index evolved to reflect the changing landscape and, in 1970, the railroad average was renamed the Dow Jones Transportation Average™.)
Becoming a Household Name
At the time of The Dow’s introduction, investing in the stock market was considered a highly speculative activity. And so in its early years, The Dow achieved little prominence outside the narrow canyon of Wall Street. By the 1920s, however, ordinary citizens began investing in stocks, driving the industrial average from the 100 range in 1924, up to nearly 400 before the Crash of 1929. Ironically, it was the market’s fall that brought The Dow’s reputation to the attention of everyday investors as the index lost nearly 30% of its value over the course of two days. Before that, investors had been more focused on their individual stocks, but after the crash investors were more interested in following general market conditions. The Dow made that possible.
Evolving Yet Constant
Since its early days the index has evolved with the U.S. economy, adding or eliminating companies as industries have gained or lost favor in the market. Despite those changes, one of The Dow’s original components, General Electric, remained in the iconic index until as recently as 2018. Through its historical continuity The Dow connects us to our financial past and offers valuable lessons, while also reflecting the current state of the market to millions of investors around the world each day. It doesn’t get closer to Charles Dow’s original vision than that.
DJIA Data, Insights and Index Solutions
-
 Get Index Data
View index levels, performance data, sector breakdowns and more.
-
 View Index-Linked Products
Explore The Dow’s investment ecosystem.
-
 Visit Indexology® Blog
Access our latest commentary on the U.S. equities market.
130 Years of The Dow:
Why It Still Matters to Asia-Pacific

Many Asian markets take cues from The Dow’s close before local trading begins the next morning. That overnight signal often influences sentiment across Asia-Pacific markets at the open.
How the DJIA Compares to the S&P 500


Not Registered?
Access exclusive data and research, personalize your experience, and sign up to receive email updates.
RegisterNot Registered?
Access exclusive data and research, personalize your experience, and sign up to receive email updates.
Register