


1. With concentration in U.S. large caps front of mind, what approaches do you see investors taking to balance risk and opportunity?
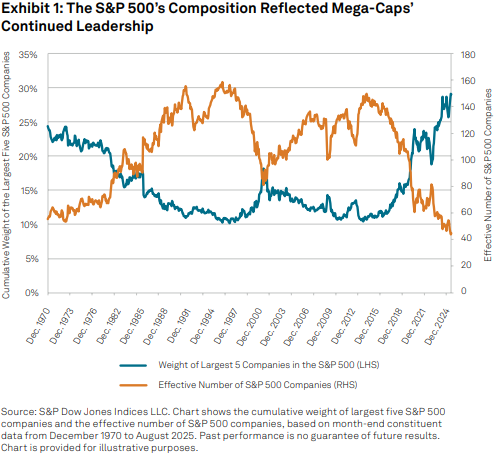
Equity market concentration has remained front of mind for many market participants. Despite underperforming during the first few months of 2025, mega caps’ leadership returned in Q2, continuing a years’ long trend. Reflecting this dynamic among large-cap U.S. equities, the cumulative index weight of the largest five S&P 500® companies hit multi-decade highs in July 2025, while the effective number of S&P 500 constituents reached multi-decade lows in the same month (see Exhibit 1).
Equal weight or capped approaches—such as those based on the S&P 500 Equal Weight Index and the S&P 500 3% Capped Index—have remained of interest to investors seeking to mitigate concentration risk and to express views on mean reversion in equity market concentrations.
However, mega caps' sustained outperformance in recent years, coupled with their resurgence in Q2 2025, may have challenged the patience and conviction of some investors that had anticipated mean reversion in S&P 500 concentration levels: the S&P 500 Equal Weight index (40%) underperformed the S&P 500 (75%) by 35% between the end of 2022 and August 2025.
Hence, many market participants may have looked to incorporate mega-cap strategies—such as those based on the S&P 100, S&P 500 Top 20 Select Index and the S&P 500 Top 50 Index—to alleviate potential underperformance from equal weight or capped approaches should the mega -cap leadership continue.
2. What is the potential relevance of U.S. mid caps in today's market and how do they differ from large caps?
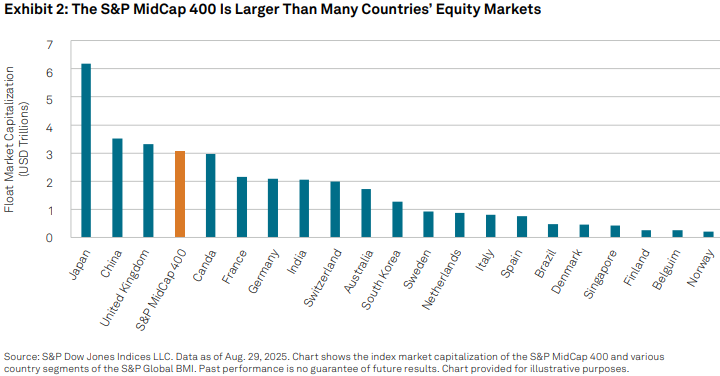
The breadth and depth of the U.S. equity market means that the mid-cap U.S. equity segment, as represented by the S&P MidCap 400®, is larger than many countries' equity markets (see Exhibit 2). For example, treated as a standalone country, the S&P 400® was the fifth largest country in the S&P Global BMI at the end of August 2025, larger than the French and German equity markets. Hence, market participants risk overlooking a significant portion of the global equity opportunity set if they ignore smaller U.S. size segments.
Market participants may also wish to consider incorporating U.S. mid caps given they appear to possess a strategic advantage relative to firms within different size ranges. Indeed, the S&P 400 has outperformed the S&P 500 since the early 1990s, and conventional Brinson attribution shows that the choice of S&P 400 companies—rather than the S&P 400's distinct sector weightings—was typically more important in explaining its relative performance. These results were not simply a smaller size effect: similar results are seen when analyzing the S&P 400's historical outperformance versus U.S. small caps, as measured by the S&P SmallCap 600®.
More tactically, perhaps, the S&P 400's distinct characteristics may be relevant for expressing views on the health of the U.S. economy and on trade policy. For example, S&P 400 companies typically have more domestically focused revenue exposures compared to the S&P 500, which contributed to the S&P 400 being more highly correlated to U.S. GDP growth, historically.
