IN THIS LIST

Index Construction Matters: The S&P SmallCap 600®

Sector Primer Series: Utilities

TalkingPoints: How to Engage ESG in More Meaningful Ways

InsuranceTalks: How Do Insurance Companies Use Fixed Income ETFs?

InvestorTalks: Using AI to Measure Market Mood with Indices

Index Construction Matters: The S&P SmallCap 600®

Contributor Image
Hamish Preston

Head of U.S. Equities

S&P Dow Jones Indices

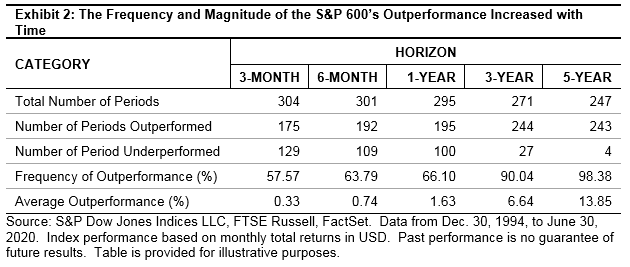
Launched in 1994, the S&P 600 is designed to track the performance of small-cap U.S. equities and has outperformed the Russell 2000 by an average of 1.6% per year over the past 25 years. This outperformance highlights the importance of index construction; unlike the Russell 2000, the S&P 600 uses an earnings screen—companies must have a track record of positive earnings before they are eligible to be added to the index. The resulting quality factor exposure has played a significant role in explaining the S&P 600’s relative returns, and why it has been a harder benchmark for active managers to beat.

RELATIVE RETURNS COMPARISON: S&P 600 VERSUS RUSSELL 2000

Exhibit 1 shows the cumulative total returns for the S&P 600 and the Russell 2000 since Dec. 31, 1994. The S&P 600 posted higher annualized returns and lower volatility than the Russell 2000 over the entire period, and it outperformed the Russell 2000 in 17 of the past 25 full calendar year periods.

Index Construction Matters: The S&P SmallCap 600®: Exhibit 1

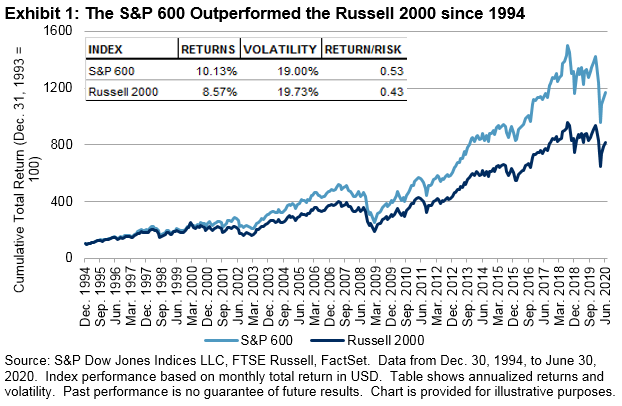
Exhibit 2 shows that the S&P 600 also typically outperformed the Russell 2000 over other horizons. Indeed, the S&P 600 outperformed over most rolling three-month, six-month, one-year, three-year, and five-year periods, with both the frequency and magnitude of outperformance increasing over longer time horizons.

Index Construction Matters: The S&P SmallCap 600®: Exhibit 2

pdf-icon PD F Download Full Article

Sector Primer Series: Utilities

Contributor Image
Sherifa Issifu

Senior Analyst, U.S. Equity Indices

S&P Dow Jones Indices

Contributor Image
Hamish Preston

Head of U.S. Equities

S&P Dow Jones Indices

The Global Industry Classification Standard® (GICS®) assigns a company to a single business classification according to its principal business activity.  This assignment uses quantitative and qualitative factors, including revenues, earnings, and market perception.  The sector is the first level of the four-tiered, hierarchical industry classification system that includes 11 sectors, 24 industry groups, 69 industries, and 158 sub-industries.

Within the GICS framework, as outlined in Exhibit 1, Utilities companies include those that are primarily engaged in:

  • Supplying electric, gas and water utilities;
  • Operating as Independent Power Producers, Gas & Power Marketing & Trading Specialists, or Integrated Energy Merchants energy traders; and 
  • Generating and distributing electricity using renewable sources.

COMPOSITION

The S&P 500® Utilities comprises all companies in the S&P 500 that are assigned to the Utilities sector by GICS. Created in 1957, the S&P 500 was the first broad U.S. market-cap-weighted stock market index. Today, it is the basis of many listed and over-the-counter investment instruments.

The Utilities sector is the fourth smallest by capitalization of the 11 sectors in the S&P 500, representing 3.07% of the index as of June 30, 2020 (see Exhibit 2). This compares to 4.17% and 2.23% for the S&P MidCap 400® and S&P SmallCap 600®, respectively. Overall, the Utilities sector accounts for 2.95% of (and 71 securities within) the S&P Total Market Index; only the Energy and Materials sectors (2.63% and 2.69%, respectively) account for less, by index weight.

With a total float-adjusted market capitalization of USD 786.16 billion, the S&P 500 Utilities sector comprised 28 companies as of June 30, 2020. The two largest companies in the sector were NextEra Energy Inc (NEE) and Dominion Energy Inc (D), with float-adjusted market caps of USD 117.55 billion and USD 68.13 billion, respectively. There were no Utilities companies in the top 10 of the S&P 500—NextEra Energy Inc ranked as the 46th largest stock, representing 0.46% of the index. The mean market cap of S&P 500 Utilities stocks was USD 28.08 billion, the median market cap was USD 20.86 billion, and the lowest market cap was USD 7.95 billion.

pdf-icon PD F Download Full Article

TalkingPoints: How to Engage ESG in More Meaningful Ways

Contributor Image
Mona Naqvi

Global Head of ESG Capital Markets Strategy

S&P Global Sustainable1

The outperformance of funds that take environmental, social and governance (ESG) issues more seriously than their peers has reinforced why investors might want to integrate these factors into portfolios via the type of tools that S&P Dow Jones Indices has developed.

Encouraged by evidence of the materiality of ESG issues during the Covid-19 led volatility, there is greater appetite for sustainable themes in investor portfolios to align investments with one’s values and potentially generate higher risk-adjusted returns. At the same time, fuelled by greater transparency over how companies act and behave, and also spurred by trends in public opinion towards issues that matter to society as a whole, investors are seeking ways to leverage data and research to gain greater exposure to ESG factors.

Amid these trends, Mona Naqvi, Head of ESG Index Strategy for North America at S&P Dow Jones Indices (S&P DJI), spoke with AsianInvestor to explain the importance of financial materiality and other key ways to assess ESG, to help it be a core building block in portfolio construction.

pdf-icon PD F Download Full Article

InsuranceTalks: How Do Insurance Companies Use Fixed Income ETFs?

With Eric Pollackov, Global Head of ETF Capital Markets, Invesco ETFs

INSURANCETALKS is an interview series where industry thinkers share their thoughts and perspectives on a variety of market trends and themes impacting indexing.

Eric Pollackov is the Global Head of ETF Capital Markets for Invesco ETFs. In this role, Eric proactively develops relationships with sell-side trading desks, implements capital market strategies for Invesco's ETFs, and develops and measures the success of client interaction.

S&P DJI: Tell us a bit about your role at Invesco and how you serve insurers.

Eric: My role puts me at the center of the ETF ecosystem, where I interact daily with ETF trade desks, exchanges, portfolio managers, and various types of clients. Our team’s goal is to provide the most seamless and efficient execution experience when using any of Invesco’s 219 U.S.-listed ETFs.

With insurers increasingly turning to ETFs, my team and I work in partnership with the institutional insurance group to assist clients in understanding the ins and outs of ETF structure, liquidity, and trading. Whether they are buying ETFs for the first time or adding onto established positions, we provide the information clients need to successfully implement their investment views via Invesco’s vast array of ETF product offerings.

S&P DJI: In the past five years, we have seen ETF AUM in insurance general accounts double; as of year-end 2019, insurers held USD 31.2 billion in ETFs. What are some of the scenarios in which insurance companies may be utilizing ETFs, and why?

Eric: ETFs provide cost-efficient, convenient, and nimble access to core and non-core asset classes, yielding a number of potential applications for an insurer’s general account. One primary use case is for manager transitions. ETFs can help insurers maintain exposure to a given asset class or market, while the due diligence and implementation processes are completed on a separate account mandate. A second application is for tactical beta tilting. Tactical beta can take on many forms, but it is traditionally used to overweight or underweight specific risk factors, sectors, or asset classes to capture short-term investment opportunities. Also notable is the use of ETFs as a liquidity sleeve in the general account to complement individual securities or managers. Holding a small liquidity sleeve of ETFs may allow insurers to facilitate cash needs in a cost-efficient way by liquidating ETF shares to raise cash, rather than meddling with core positions in the portfolio.

pdf-icon PD F Download Full Article

InvestorTalks: Using AI to Measure Market Mood with Indices

INVESTORTALKS is an interview series where industry thinkers share their thoughts and perspectives on a variety of market trends and themes impacting indexing.

Indexing and artificial intelligence (AI) are democratizing access to institutional quality risk management. The S&P Riskcasting® Indices are designed to help keep risk in check, using AI to track signals of investor views on market risk and systematically adjusting allocations based on the signals received. S&P DJI joins Arnaud de Servigny to discuss how these innovative indices track the mood of the market to dynamically capture potential opportunities.

What's inside the S&P Riskcasting Index Series, and what is it designed to do?

S&P DJI: The index series is a rules-based, systematic multi-asset strategy that incorporates equity and fixed income. It uses a risk aversion signal to determine three different market states: bullish, neutral, or bearish. Based on the determined market state, the S&P Riskcasting Indices will allocate to different equity or fixed income indices. For example, the S&P 500® Riskcasting Index uses the S&P 500 and the S&P 10-Year Treasury Note Futures Index as its components, whereas the S&P 500 Low Volatility Riskcasting Index uses the S&P 500, S&P 500 Low Volatility Index, and S&P 10-Year Treasury Note Futures Index as its three components.

How does the risk aversion signal use S&P 500 options to measure the mood of the market?

Arnaud de Servigny: Generally, looking at risk in the finance industry, we tend to have backward-looking information on volatility and things like that. In a way, it is like looking in the rearview mirror while driving a car. What we want to do, however, is to look at what is going on right now or in the near future, and for this type of analysis we look at option markets. In the option markets, there are many different participants with many different views, and it is the diversity of these views that is interesting. If the overall market mood evolves in one direction or another, then this is something that is likely to have an impact on market performance, especially the equity market, which is what we want to capture.

pdf-icon PD F Download Full Article

Processing ...