IN THIS LIST

Identifying and Implementing Net-Zero-by-2050 Strategies: A Case Study

Why Does the S&P 500® Matter to Japan?

Transition to Net Zero with the S&P PACT™ Indices (S&P Paris-Aligned & Climate Transition Indices)

TalkingPoints: Measuring Social Media's Market Impact with the S&P 500 Twitter Sentiment Index Series

FAQ: S&P 500 Twitter Sentiment Index Series

Identifying and Implementing Net-Zero-by-2050 Strategies: A Case Study

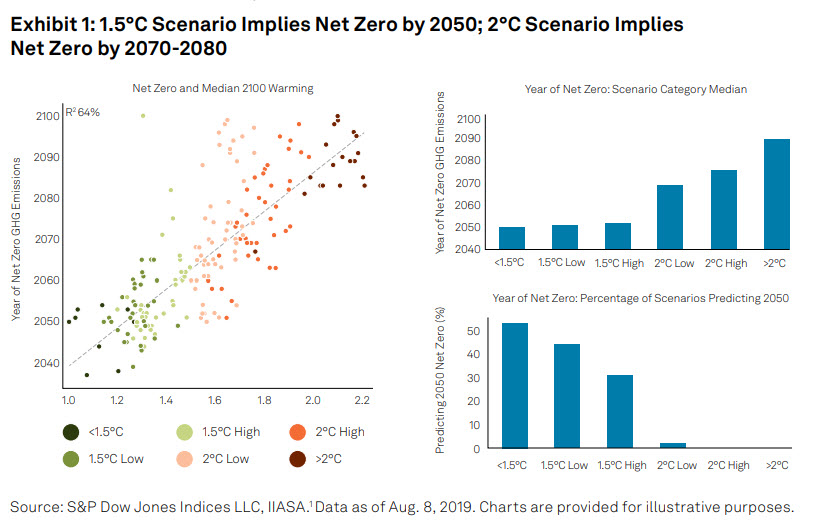
Typically, low-carbon indices have largely seen relative decarbonizations— improvements against the underlying index—but not Paris Agreement-aligned absolutely sustainable strategies. To be aligned with the Paris Agreement (i.e., a net zero scenario) and absolutely sustainable with regards to greenhouse gas (GHG) emissions, a strategy must align with a specified GHG emissions reduction pathway. To reach net zero by 2050, scientific consensus explains that 1.5°C scenarios would likely help to meet this goal, while 2°C scenarios would most likely reach net zero closer to 2070-2080 (see Exhibit 1).

Identifying and Implementing Net-Zero-by-2050 Strategies: A Case Study: Exhibit 1

While net zero alignment may be a key target, it isn’t the only climate or ESG concern faced by investors. The changing climate potentially exposes us to transition and physical risks, while other broader ESG factors may be ethically desirable, financially material, or both. Many of these ESG factors are uncorrelated, which can make it difficult to understand what the real goal is for a multifaceted ESG investing strategy. The question then becomes: how best to align with a targeted climate scenario and can this be done alongside other ESG objectives?

pdf-icon PD F Download Full Article

Why Does the S&P 500® Matter to Japan?

Contributor Image
Priscilla Luk

Managing Director, Global Research & Design, APAC

Contributor Image
Tim Wang

Senior Analyst, Global Research & Design

The S&P 500 is a renowned benchmark for large-cap U.S. equities.  The index is designed to measure 500 leading companies and covers approximately 80% of investable market capitalization in the U.S. equity market.  As of year-end 2020, over USD 13.5 trillion was benchmarked to the S&P 500 alone, with indexed assets making up USD 5.4 trillion of this total. Exchange-traded products based on the S&P 500 have been cross-listed in various markets across the globe, but what creates the international appetite for U.S. equities, especially the S&P 500?

In this paper, we will:

  • Compare the S&P 500 to the leading equity benchmark in Japan;
  • Explore the significance of the S&P 500 in the global equity market; and
  • Compare S&P 500 performance to that of active U.S. large-cap funds.

COMPARISON OF THE S&P 500 AND THE TOPIX

The S&P 500 and the TOPIX are widely regarded as primary performance indicators for the U.S. and Japanese equity markets, respectively.  Both indices have been commonly used as benchmarks for investment in domestic stocks or equity funds for decades. However, the indices vary significantly due to the different economic landscapes and financial market developments they reflect.

The TOPIX consists of 2,000 domestic common stocks listed on the Tokyo Stock Exchange First Section, while the S&P 500 comprises 500 leading U.S. companies representing around 80% of the market cap of the U.S. equity market.  Index members for both indices are weighted by their free-float market capitalization.  Despite the fact that the number of S&P 500 members is only one-quarter of the number of TOPIX constituents, the float-adjusted market cap of the S&P 500 is 10 times that of the TOPIX.

pdf-icon PD F Download Full Article

Transition to Net Zero with the S&P PACT™ Indices (S&P Paris-Aligned & Climate Transition Indices)

Contributor Image
Ben Leale-Green

Associate Director, Research & Design, ESG Indices

Contributor Image
Barbara Velado

Senior Analyst, Research & Design ESG Indices

S&P Dow Jones Indices

Contributor Image
Mona Naqvi

Global Head of ESG Capital Markets Strategy

S&P Global Sustainable1

Backed by evidence from the UN Intergovernmental Panel on Climate Change (IPCC), ambition has grown to limit global temperature rise to 1.5°C since pre-industrial levels, reaching net zero by 2050.  Currently, 70% of global CO2 emissions are covered by net zero targets (IEA, 2021).

To date, climate-conscious investors have largely focused on reducing relative portfolio carbon exposure; however, a combination of new forward-looking datasets and index innovation is emerging.  Investors now have the choice to align with a scenario that may mitigate the most catastrophic impacts.  The European Union (EU) has defined minimum standards for the EU Climate-Transition Benchmarks (CTB) and EU Paris-aligned Benchmarks (PAB), both of which are absolutely 1.5°C and 2050 net zero compatible. Our S&P PACT Indices offer a sophisticated, but accessible, solution for investment product providers to incorporate these standards and further climate objectives, which will support investors to:

  1. Implement the objectives of the Paris Agreement and align investments with a 1.5°C trajectory toward achieving net zero emissions by 2050;
  2. Adopt a strategy intended to meet the minimum standards for EU CTBs and EU PABs and recommendations from the Task Force on Climate-related Financial Disclosures (TCFD)—accounting for the physical risks, transition risks, and opportunities arising from climate change; and
  3. Address other climate objectives in an efficient manner, while staying as close to the underlying index as possible with broad, diversified exposure.

    This paper underscores how the S&P PACT Indices could help investment product providers transition to a 1.5°C world and achieve other climate objectives, utilizing an accessible index construction.

    pdf-icon PD F Download Full Article

    TalkingPoints: Measuring Social Media's Market Impact with the S&P 500 Twitter Sentiment Index Series

    Social media is a relevant aspect of community life around the world. So what happens when we measure that engagement through a financial markets lens? S&P Dow Jones Indices (S&P DJI) has launched its first indices that are designed to measure social media sentiment through the S&P 500 Twitter Sentiment Index Series. Therese Simberg, Director, Innovation and Strategy at S&P DJI, discusses the creation of the indices and what they mean in the evolution of innovative indexing, as well as the more practical uses for investors on tracking social media sentiment.

    1. What drove the creation of this new index series?
      Over the last few years, social media has evolved in that more and more people are Tweeting about stocks and financial markets. This includes the financial community, such as traders, analysts, and investors, as well as the general public who want to express their opinions.

      As the technology has improved, these views and Tweeted opinions from this online community are now able to be analyzed; as a result, it is possible to interpret and try to understand what the market is saying about a specific company by aggregating an analysis of underlying Tweets containing $cashtags, which indicate that the Tweet is concerning a particular stock. Through artificial intelligence, a particular stock's Tweets can be analyzed to see whether the overall sentiment is, on balance, positive or negative based on the collective opinion as expressed through these Tweets. This analysis lends itself well to indexing, as we now have a way of classifying stocks and creating an index that reflects the opinions of the Twitter community.

      To summarize, the S&P 500 Twitter Sentiment Indices have been created to reflect the companies in the S&P 500 that have the most positive sentiment as indicated by the Twitter community. The indices include companies with positive sentiment relative to their peers.

    2. Why are you choosing to launch these indices now?
      Social media is transforming the way information is conveyed to investors, and it contains significant and differentiated information about individual stocks, as well as broad market information. Social media is unique in that it is a place for various market opinions to be combined into one public forum, including opinions from different types of participants like professional analysts, the media, investors, and the general public.

      Even though the impact of social media in the financial market is not a new phenomenon, more recently the world has seen high-profile situations that have clearly showcased that impact. The S&P 500 Twitter Sentiment Indices aim to help investors gauge the impact of social media, albeit over a longer time period and across a more diversified set of equities than typical day trading.

    pdf-icon PD F Download Full Article

    FAQ: S&P 500 Twitter Sentiment Index Series

    1. What is the S&P 500 Twitter Sentiment Index Series? The S&P 500 Twitter Sentiment Index Series screens the S&P 500 through the use of sentiment scores derived from Tweets containing $cashtags that reference the equity symbols of S&P 500 index constituents. These Tweets are screened and scored via machine learning and natural language processing (NLP) to calculate a daily score for each stock in the S&P 500 and select the top constituents to include in each of the S&P 500 Twitter Sentiment Indices at monthly rebalance. For more information about the S&P 500 Twitter Sentiment Indices, please see the index methodology:
      https://www.spglobal.com/spdji/en/documents/methodologies/methodology-sp-twitter-sentiment-indices.pdf.

    2. Why was the S&P 500 Twitter Sentiment Index Series created? The S&P 500 Twitter Sentiment Index Series was created to reflect the performance of the names with the most positive sentiment within the S&P 500 over a given period of time.

    1. What specific indices are included in the S&P 500 Twitter Sentiment Index Series? As of Nov. 18, 2021, the index series consists of the following indices:

      S&P 500 Twitter Sentiment Index: This index is designed to track the performance of the 200 constituents with the most positive sentiment from the S&P 500, which are weighted on a float-adjusted market capitalization (FMC) basis, with a 10% cap at rebalance.

      S&P 500 Twitter Sentiment Select Equal Weight Index: This index is designed to track the performance of a selection of the 50 constituents with the most positive sentiment from the S&P 500, which have been equally weighted at rebalance.

      Note that in order to be considered for either index, each company must have a sufficient number of Tweets containing $cashtags that reference the equity symbol of the company over the last month (after filtering for spam has been applied) for that sentiment score to be considered robust enough for inclusion. The number of companies without sufficient Tweet volume may vary from month to month depending on market conditions. Both indices have a decay factor applied to their daily scores at rebalance in order to ensure the most recent information is given higher importance.

    2. What is Twitter’s role in the S&P 500 Twitter Sentiment Indices? S&P DJI teamed up Twitter to create this index. In addition to co-branding, Twitter supplies the data necessary to score the S&P 500 members' sentiment on a daily basis.
    3. How does the scoring of the S&P 500 constituents work? At each rebalancing, the index selects constituents from the S&P 500 universe that have the most positive sentiment over a fixed time period and have sufficient Tweet volume to be scored. Sentiment scores are derived from an analysis of a daily feed of Tweets containing $cashtags that reference the equity symbol of a company. Each stock is scored daily, and these stocks' scores are aggregated on a monthly basis, with more recent activity receiving higher weights, given that recent sentiment often has a greater impact. All of these final monthly scores are ranked in order to create the index reconstitution for the next monthly time period.

    pdf-icon PD F Download Full Article

    Processing ...