











































As the Dow Jones Industrial Average® celebrates its 130th anniversary on May 26, 2026, the occasion offers a moment to reflect on the continuity, evolution and disciplined stewardship that have helped sustain one of the world’s most widely recognized benchmarks—a barometer of U.S. equity market performance that media and investors have continued to reference across generations.
Measuring the Market across Generations
On May 26, 1896, Charles Dow added up the stock prices of 12 industrial companies, divided by 12 and published the result in The Wall Street Journal. The number was 40.94. The calculation took pencil, paper and a few minutes of arithmetic.
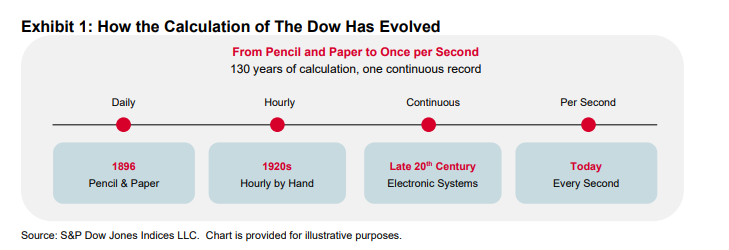
By the 1920s, Arthur “Pop” Harris was computing The Dow on an hourly basis for the Dow Jones News Service, translating market activity into a steady measure that investors could follow through the trading day. By the late 20th century, calculation had moved to electronic systems. Today, The Dow is calculated and disseminated once every second of every trading day.
The process has evolved, but the objective has endured. For 130 years, someone—first Charles Dow himself, then a succession of editors, analysts and index professionals—has maintained this measure of U.S. equity performance through changing market structures, technologies and economic eras (see Exhibit 1). Its continuity is not incidental—it reflects stewardship.
The Dow’s Transition to a Public Market Barometer
In its first three decades, The Dow served an important role within Wall Street as a practical measure of market trends. Investors in the early 1900s often focused on individual stocks, not broad market averages. The Dow’s purpose was already evident, even as its broader public role was still emerging.
That changed during the market crash of October 1929. Over the course of two trading days, the index lost nearly a quarter of its value. The crash did not create The Dow’s relevance, but it did reveal it. Before the crash, most investors focused on the individual stocks they owned. After the crash, investors, newspapers and broadcasters increasingly looked to a broad market measure to help answer a basic question: how is the market doing?
The Dow increasingly became that barometer. From that point forward, the accuracy, consistency and governance of the average were not merely operational matters—they were matters of public trust.
Investors following the market, newspapers printing the closing level and broadcasters reporting the day’s move all relied, in some way, on the integrity of the benchmark.
Evolution through Stewardship
Maintaining an index for 130 years is not a matter of leaving it alone, nor is it a matter of constant intervention. It is a matter of a stable methodology and governance framework that allows the index to continue meeting its stated objective as market conditions evolve.
The Dow launched with 12 companies across industries such as cottonseed oil, sugar, tobacco, leather, rubber, gas, steel and electricity. The roster expanded to 20 stocks in 1916 and to its current 30 in 1928. Component updates are made with the objective of ensuring that the index continues to meet its stated objectives as markets evolve, reflecting a proactive governance process rather than a reactive one. Woolworth gave way to Walmart. Kodak gave way to Intel. Intel, in turn, gave way to Nvidia. Over time, component updates have reflected The Dow’s objective of assessing market leadership, sector representation and the composition needed to keep the average reflective of leading U.S. companies across the sectors the index is designed to represent.
