


August 2025 Commentary
Market Overview
Several economic indicators have been pointing toward a recession in the U.S. economy in recent months. Particularly, the Conference Board Leading Economic Index (LEI) released on Aug. 21, 2025, fell by 0.1% in July amid weak new orders and pessimism about business conditions. The LEI has been signaling a recession for the past six months. The Bureau of Labor Statistics’ downward revisions of the previous months’ job reports in August showed that hiring is frozen, with only 33,000 jobs added in May and June. The market expects rate cuts in the next three to six months, particularly after the Fed’s Jackson Hole meeting that cited higher tariffs, a slowdown in payroll job growth and a GDP of 1.2% in the first half of 2025, compared to 2.5% in 2024.
Looking across the pond, inflation in the EU was reported at 2.1% in August, a higher than expected figure influenced by services and energy. In the EU area (which includes emerging market economies) unemployment went down to 5.9%.
In Brazil, GDP grew 0.4% in the second quarter when compared to Q1 2025 due to services and household consumption, despite the imposition of 50% tariffs on Brazilian imports by the U.S. The HSBC India Manufacturing PMI released on Sept. 1, 2025, was up 59.3 in August, reflecting an acceleration in production and new orders volume.
August 2025 Performance
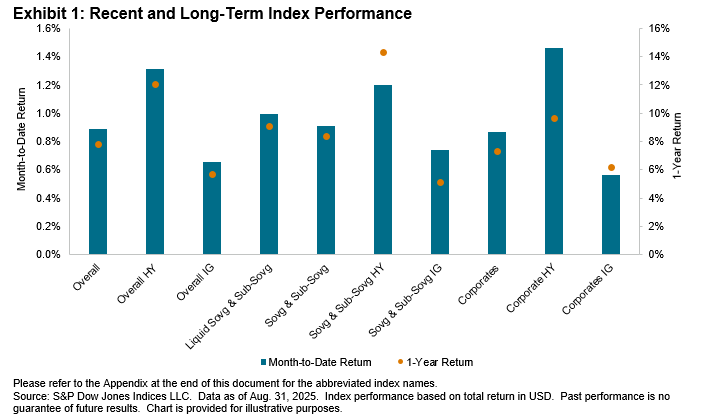
In August, the iBoxx USD Emerging Markets indices increased compared to July. The Overall returned 1.31%, reflecting a 43 bps increase, while the Overall HY rose to 1.48%. The Sovg & Sub-Sovg HY gained 1.57%, outperforming the Sovg & Sub-Sovg by 19 bps, while the Sovg & Sub-Sovg IG lagged by 12 bps, at 1.26%, compared to the benchmark. The Liquid Sovg and Sub-Sovg demonstrated an impressive performance this month at 1.46%, marking a 47 bps increase compared to last month. The Corporates HY was up 1.38%, reflecting an 8 bps decrease compared to July, but it was higher than Corporates, which gained 1.24%. All indices are on track to meet or exceed their one-year returns (please refer to the Appendix at the end of this document for the abbreviated index names).
August marked another contraction in yields for the top 10 markets. Notably, yields contracted by 29 bps for Turkey, bringing the yield down to 6.85%. South Korea’s yields tightened by 26 bps this month, reaching 4.43%. China, the world’s second-largest economy, saw its yields contract by 19 bps, down to 4.95%, while the one-month gain was 1.02%. The best-performing economies this month were Mexico at 1.72%, Turkey at 1.66% and Chile at 1.32%.
