


Market Review
Liquidity is one of the most fundamental features of a developed market, and well-constructed index methodologies are essential for supporting the broader financial ecosystem. This paper examines how key liquid fixed income indices performed in 2025—a year defined by shifting monetary policy, an evolving fiscal landscape and strong credit market performance.
The U.S. Federal Reserve cut rates three times in 2025, totaling 75 bps and bringing the Fed funds rate to 3.75%¹ by the end of the year. The cuts were driven by a softening labor market and weakening economic indicators, including a manufacturing PMI that fell to 47.9%² in December—its lowest reading of the year and a sign of continued contraction. At the same time, fiscal dynamics intensified. U.S. national debt reached a record USD 38.59 trillion³ at the end of December, with the passage of the U.S. tax and spending bill projected to add another USD 3.4 trillion⁴ over the 2025-2034 period. Record bond issuance in the AI sector—reaching USD 121.5 billion⁵—further expanded the supply landscape, raising questions about issuers’ long-term ability to service that debt and achieve profitability.
Despite this complex backdrop, 2025 proved to be a strong year for fixed income. Rate cuts supported duration-sensitive assets, credit spreads compressed to near multi-year tights and the liquid indices posted positive performance—led by emerging market credit, which benefited from a weakening U.S. dollar. Credit default swap (CDX and iTraxx) indices offer a real-time lens into how the market priced risk throughout the year. We begin with a review of CDX spread activity across investment grade, high yield and emerging market credit segments.
2025 CDX Spread Activity
All Spread Levels Reflect Conventional Spreads
Over the past five years, CDX markets have traced a full cycle of pandemic-era dislocation, inflation-driven repricing and subsequent normalization. Across investment grade, high yield and emerging market credit, year-end 2025 levels sit notably below their respective five-year averages—underscoring how much risk premia have compressed from the 2022-2023 wides.
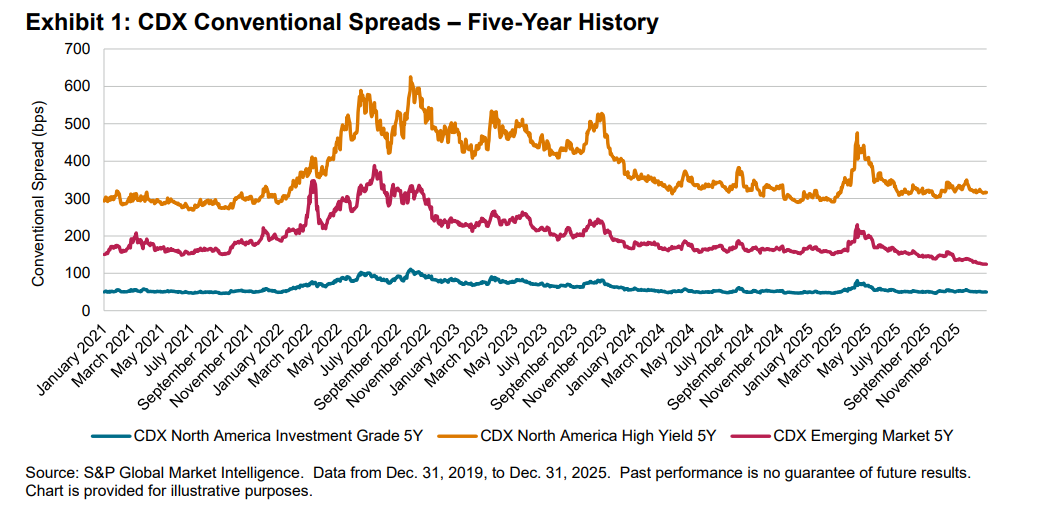
CDX North America Investment Grade
Over the five-year period, the CDX North America Investment Grade averaged 61.8 bps but traded through pronounced peaks above 110 bps in 2022, as interest rate volatility, inflation uncertainty and banking sector stress pushed spreads wider. The subsequent compression through 2023-2025 reflects the asset class’s resilience, supported by strong balance sheets and muted downgrade/default activity.
Looking at the one-year trend, the CDX North American Investment Grade ended 2025 at 50 bps, nearly identical to 49.9 bps at the end of 2024. The index traded in a tight 50 bps-60 bps corridor through most of 2025, reinforcing how investment grade credit has re-anchored near the lower end of its post-COVID-19 range. The index briefly moved into the mid-60 bps area during early March 2025, reaching its intra-year high before tightening steadily into year end. Relative to its five-year average, the CDX North America Investment Grade closed 2025 roughly 12 bps tighter, highlighting a structurally healthier credit backdrop for this segment.
