










































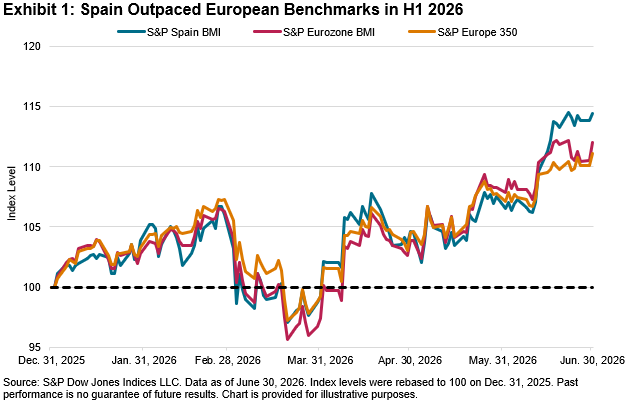
Among many rising European equity markets, Spain had one of the stronger starts to the year, surpassing countries such as France (up 4%), the U.K. (up 9%) and Ireland (up 11%) in the first half of 2026. The S&P Spain BMI gained 14% YTD through June 30, 2026, outperforming the S&P Europe 350® (up 11%) and the S&P Eurozone BMI (up 12%) (see Exhibit 1).1
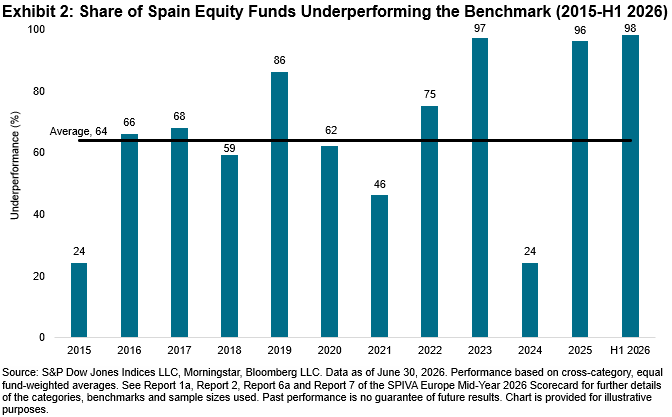
Yet strong index gains do not, in themselves, make life easier for active managers. In the SPIVA® Europe Mid-Year 2026 Scorecard, 98% of the 50 Spain Equity funds underperformed the S&P Spain BMI, a higher share than in other major European markets, including Germany (48%), France (61%) and Italy (81%). Underperformance was similarly high across the 1-, 3-, 5- and 10-year periods.
The striking feature is not simply that underperformance was widespread, but that it was high relative to history (see Exhibit 2). Over the past decade, the average annual underperformance rate was 64%, while in years such as 2015 and 2024 it fell as low as 24%. Why, then, was it so difficult for Spanish fund managers to keep pace with the benchmark in the first half of 2026?
One thing that did change in H1 2026 was the spread of stock-level performance. Average dispersion across S&P Spain BMI constituents, measured on a trailing six-month basis, rose from 19% at the end of December 2025 to 22% by June 2026. A wider gap between the best and worst performers generally give stock pickers more to work with, but only if they own the right stocks.
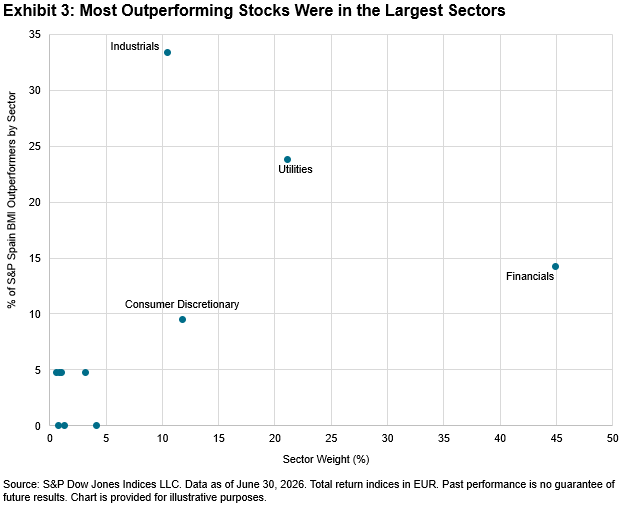
But rising dispersion did not mean broad leadership. In Spain, leadership was concentrated, with most of the index’s performance driven by three sectors: Industrials, Utilities and Financials, which together accounted for roughly three-quarters of the index's weight (see Exhibit 3). In a market with narrow leadership, funds with less exposure to a sufficient number of high-performing stocks from those sectors relative to the benchmark could have faced a headwind.
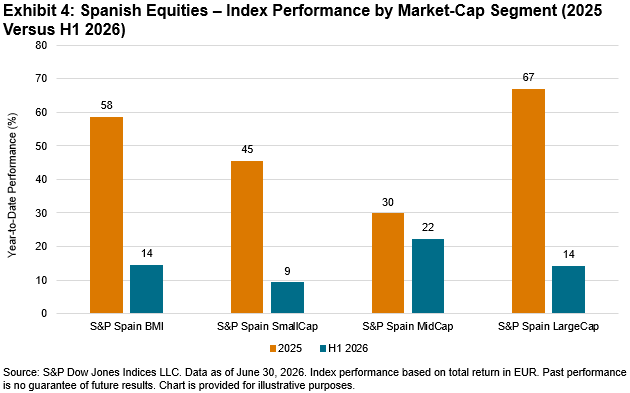
Performance also diverged by size. In H1 2026, the S&P Spain MidCap gained 22%, compared with 14% for the S&P Spain LargeCap and 9% for the S&P Spain SmallCap. This reversed the pattern seen in 2025, when large caps led by a wide margin (see Exhibit 4). The strength of mid-cap stocks in the first half of 2026 may have been missed by some managers who were more focused on the larger constituents in the benchmark.
So, what did the first half of 2026 teach us about Spain? Outperformance proved hard to come by; even with growing dispersion across S&P Spain BMI constituents and a clear lead for mid caps, gains were concentrated in a handful of sectors and 98% of funds still trailed the benchmark. Predicting where active managers go from here is likely to be just as difficult as predicting where the market goes next. Will the pattern hold or reverse by year-end? Only time will tell, so stay tuned for our SPIVA Europe Year-End 2026 Scorecard to see how the year unfolded in Spain and across broader Europe.
1 Index performance based on total return in EUR.
The posts on this blog are opinions, not advice. Please read our Disclaimers.