







































IN THIS LIST

A Tale of Two Markets

Fundamental Weighting for Long-Term Outperformance and Enhanced Diversification: The S&P 500 Revenue-Weighted Index

Introducing the S&P 500 Market Leaders Index

Introducing the S&P 500 Realized Dispersion Indices

Tariff Turmoil Shines Spotlight on S&P/ASX Geographic Revenue Exposure Indices

A Tale of Two Markets

Contributor Image
Anu R. Ganti

Head of U.S. Index Investment Strategy

S&P Dow Jones Indices

After the volatility witnessed in early April, U.S. equities have staged a remarkable recovery over the past couple of weeks, with the S&P 500® up 1% YTD through May 15, 2025, reversing its 15% YTD decline through April 8, 2025. Thanks to optimism surrounding easing tariff tensions and strong Big Tech earnings, mega caps have rebounded, with the S&P 500 Top 50 outperforming The 500™ by 1.2% QTD.

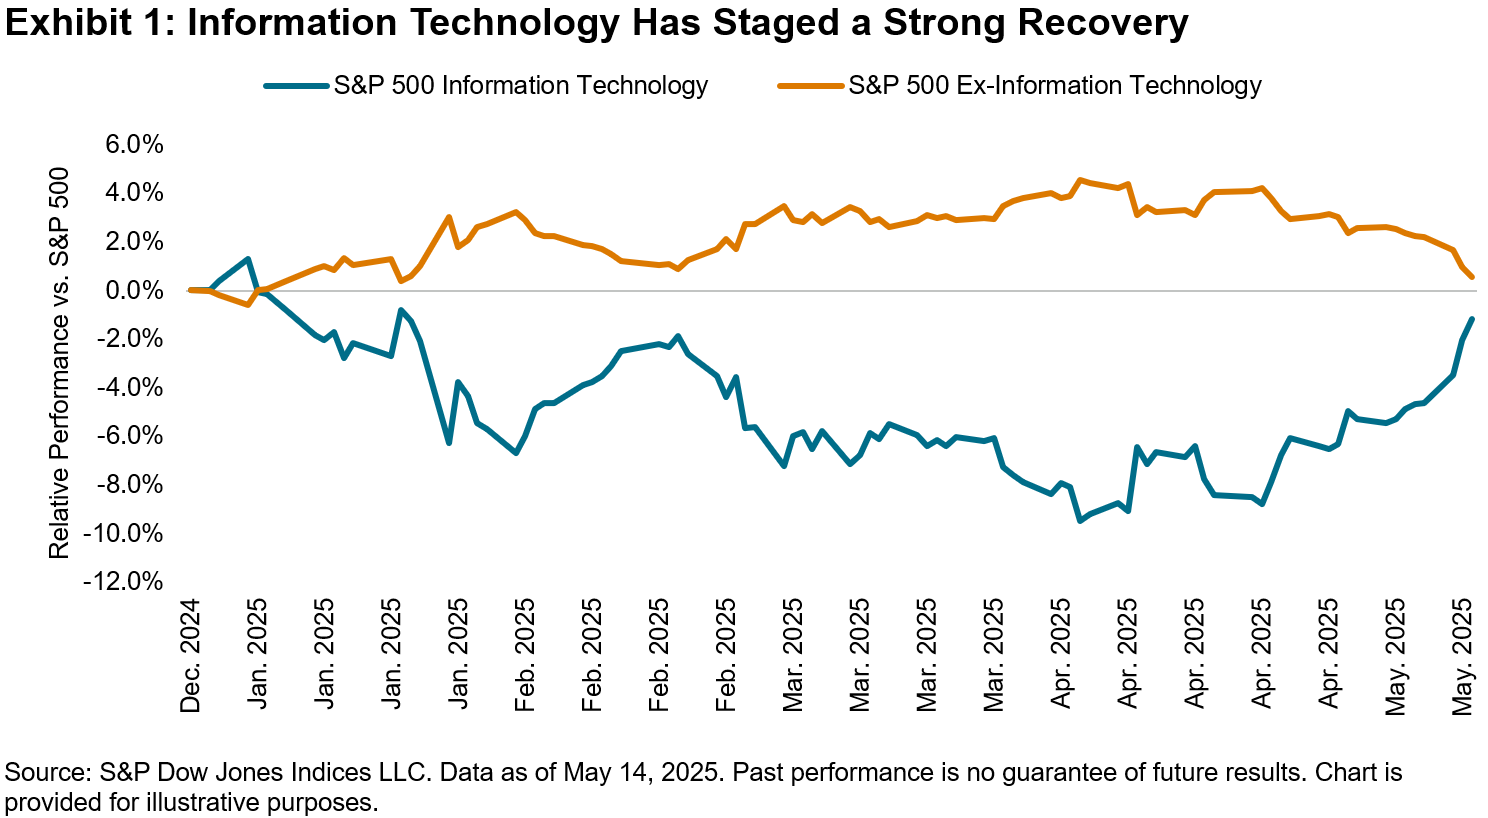
The outperformance of larger stocks has been driven by the Information Technology (IT) sector, with the S&P 500 Information Technology up 14% QTD. Exhibit 1 illustrates that the disparity in performance between IT and the rest of the market has narrowed since the early April turmoil, as stocks from the sector have strengthened. The S&P 500 Information Technology has underperformed The 500 by 2% while the S&P 500 Ex-Information Technology has outperformed by 0.8% YTD.
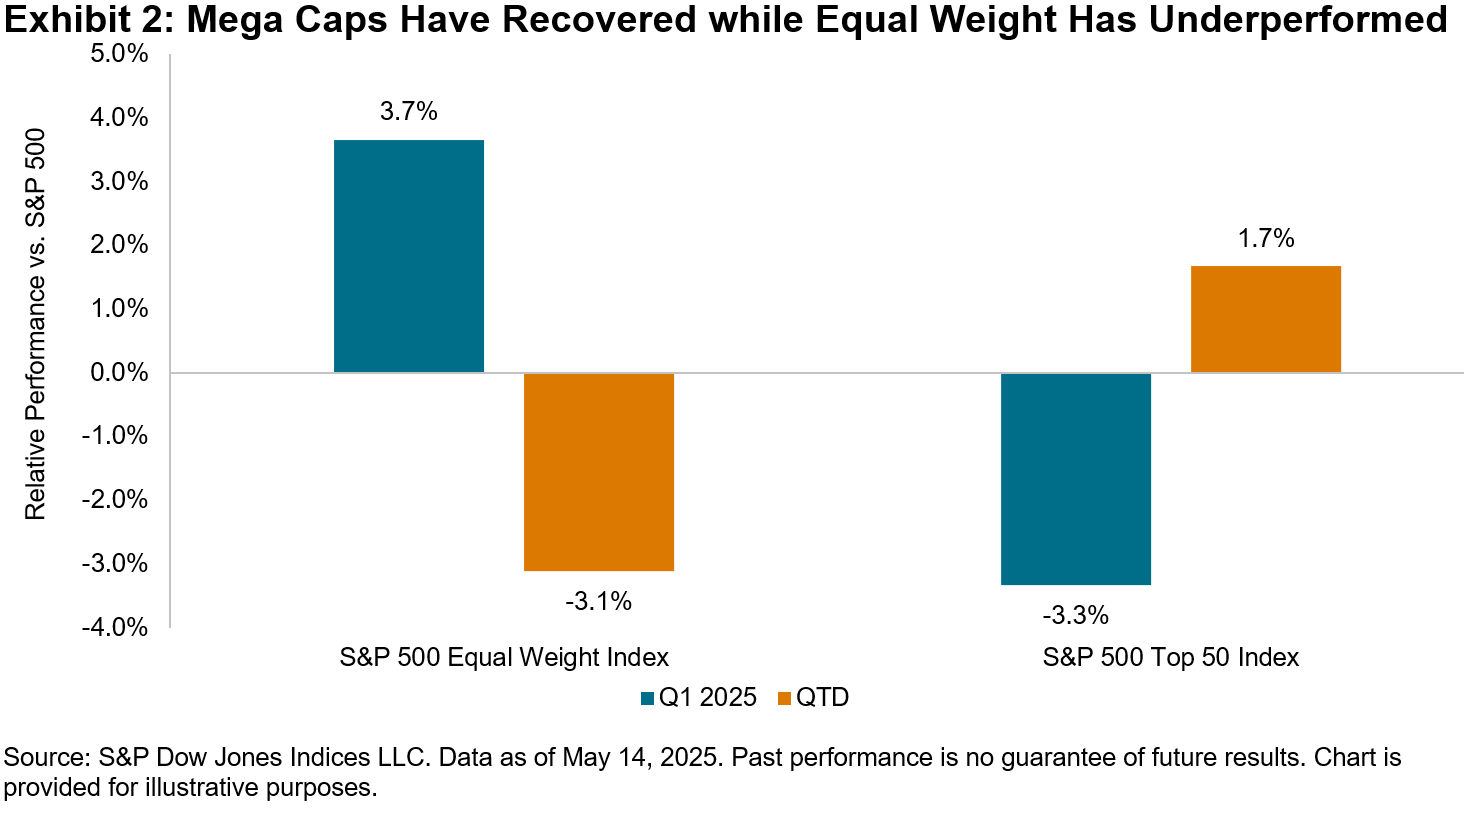
Meanwhile, the S&P 500 Equal Weight Index, which has a smaller-cap bias by design, has underperformed The 500 by 3% so far this quarter. Exhibit 2 shows that the outperformance of mega caps and underperformance of equal weight has been a notable reversal compared to Q1 2025, which was characterized by mega-cap underperformance and equal weight's outperformance.
Combining a size perspective with a sector perspective through a sector attribution of the S&P 500 Equal Weight Index versus the S&P 500 can help to understand the shifts in the equal weight index's relative performance seen in Exhibit 2. Exhibit 3 illustrates that cross-sector weighting, or sector weight differences, were the key driver of the index's outperformance in Q1 2025, stemming primarily from the underweight to IT. In contrast, so far this quarter, the underweight to IT has turned from a performance contributor to a performance detractor, consistent with the sector's recent strong performance.

Although IT has made a significant comeback, the sector's diversification properties have diminished. In Exhibit 4, we calculate the spread in trailing 12-month volatility between the S&P 500 versus the S&P 500 Ex-Information Technology. When this spread is positive, the inclusion of the sector increases volatility in the benchmark; when negative, the sector acts as a diversifier. Note that the positive spread for IT has continued to increase, approaching levels last seen during the Tech bubble.

Zooming out, Exhibit 5 indicates that dispersion among S&P 500 sectors has trended upward since the start of the year. With a 24% QTD performance spread between the leading Information Technology and laggard Health Care sectors, sector allocation decisions may continue to be especially important.


Fundamental Weighting for Long-Term Outperformance and Enhanced Diversification: The S&P 500 Revenue-Weighted Index

Contributor Image
Wenli Bill Hao

Director, Factors and Dividends Indices, Product Management and Development

S&P Dow Jones Indices

By weighting the constituents of the S&P 500® based on top-line revenue, the S&P 500 Revenue-Weighted Index offers an alternative to traditional benchmarks that are weighted by float market cap (FMC). This approach aims to better reflect the fundamental strength of each company, while offering better valuations and enhanced diversification. In this blog, we will analyze its methodology, examine short- and long-term performance, explore style tilts and assess diversification.

Year-to-Date Performance

So far this year, the S&P 500 Revenue-Weighted Index has outperformed The 500™ by more than 4.5% and surpassed the S&P 500 Equal Weight Index by more than 2.0% (see Exhibit 1).

Long-Term Performance

This recent outperformance is consistent with its historical track record. As shown in Exhibit 2, the S&P 500 Revenue-Weighted Index has outperformed both the S&P 500 and S&P 500 Equal Weight Index in terms of total return and risk-adjusted return over the long term, all while maintaining consistently lower volatility.

Upside Participation and Downside Protection

The historical capture ratios (Exhibit 2) show that the S&P 500 Revenue-Weighted Index has typically participated one-for-one in up markets,1 while delivering significant outperformance during down markets. This aligns with the design of revenue-weighted indices, which tend to provide a closer reflection of the broader economy and avoid overweighting overvalued stocks.

Methodology

The S&P 500 Revenue-Weighted Index assigns weights to its constituents proportional to their revenues from the past four quarters. To provide broader coverage and reduce concentration risk, individual constituent weights are capped at 5%, and the index rebalances quarterly in March, June, September and December.

Weighting by revenue may better reflect the broader economy, as revenue is directly tied to economic activity. Additionally, revenue serves as a direct indicator of a company's ability to generate income and is less susceptible to accounting manipulations.

Valuations

As illustrated in Exhibits 3a and 3b, the S&P 500 Revenue-Weighted Index generally exhibited better valuations than the S&P 500 Equal Weighted Index and The 500.2

Sector Weights

As shown in Exhibit 4, revenue weighting has often resulted in more stable sector weights (as measured by lower standard deviation) compared to the weighting scheme driven by price, as revenues tend to be relatively stable. Moreover, the S&P 500 Revenue-Weighted Index held the largest weight in Consumer Discretionary, while Information Technology was the largest sector in The 500.

Diversification

When examining individual stocks, the S&P 500 Revenue-Weighted Index demonstrated greater diversification than The 500, featuring a lower max stock weight and a higher effective number of stocks (see Exhibit 5).

Conclusion

The S&P 500 Revenue-Weight Index presents an alternative to traditional market cap-weighted benchmarks, emphasizing fundamentally strong companies based on revenue. It has consistently delivered robust total returns and risk-adjusted outperformance over both the short and long term. In comparison to FMC-weighted benchmarks, it has historically offered greater value tilt, reduced concentration risk and more stable sector weights.

1 The market is defined as the monthly performance of the underlying benchmark (i.e., S&P 500) from Dec. 31, 1994, to March 31, 2025.

2 Historic price/book ratios show a similar trend to price/earnings and price/sales ratios.

3 Effective number of stocks is the inverse of the Herfindahl-Hirschman Index (HHI), which is the sum of squared stock weights for each index in each period.


Introducing the S&P 500 Market Leaders Index

Contributor Image
Elizabeth Bebb

Director, Factor & Dividend Indices

S&P Dow Jones Indices

The S&P 500® Market Leaders Index is designed to track companies within the S&P 500 that hold significant market share and sustainable competitive advantages. Unlike the broader S&P 500, this index zeroes in on companies that consistently outperform their peers in terms of return on invested capital (ROIC), free cash flow (FCF) generation and substantial market presence. In this blog, we will delve into how this index is constructed, examine its back-tested performance and highlight its unique characteristics.

Methodology Overview

The S&P 500 Market Leaders Index selects companies using a Market Leader Score based on the average of three key metrics.

  1. High Market Share: This metric may indicate competitive advantages like economies of scale, network effects or strong brand power. Companies with high market share often have better pricing power and higher returns.
  2. Sustained High ROIC: Calculated as the five-year average of net income divided by total equity plus total debt, this metric assesses profitability and reflects a company's efficiency in capital utilization. Market leaders often exhibit stronger ROIC due to their dominant market positions.
  3. Consistent High FCF Margin: Companies that maintain consistently high FCF margins over five years, combined with high ROIC, tend to be able to effectively redeploy cash flow, helping them maintain market share.
The top 50 companies ranked by Market Leader Score are included in the index and are weighted by float-adjusted market capitalization (FMC).

Historical Performance Characteristics

The S&P 500 Market Leaders Index has demonstrated impressive long-term performance compared to the benchmark. As shown in the back-tested period covered in Exhibit 2, it has outperformed with lower volatility, leading to better risk-adjusted returns. The index not only offered greater upside potential but also a defensive stance. Notably, during the recent tariff-related drawdowns, the S&P 500 Market Leaders Index outperformed the benchmark by 2.23%

Historical Drawdowns

The S&P 500 Market Leaders Index has often benefited from downside protection during past market sell-offs.

Higher Quality Constituents

Historical fundamental analysis of the index reveals a greater focus on profitability metrics that align closely with the quality factor.

Sector weights have been diversified and historically skewed toward Consumer Staples, Health Care and Information Technology compared to the benchmark, with underweights in Energy and Industrials. As of Dec. 31, 2024, the index showed overweights in Consumer Staples, Financials and Information Technology, while Health Care was underweight.

Historical Macroeconomic Performance

The S&P 500 Market Leaders Index tended to outperform the benchmark in most market environments but had the highest performance in periods of falling growth, regardless of inflation.

Conclusion

The S&P 500 Market Leaders Index tracks 50 of the most consistently high-performing companies in the U.S. equity market. By focusing on ROIC, FCF margin and market share, the index seeks to identify market leaders with sustainable competitive advantages. Historically, this approach has identified higher-quality companies that exhibited defensive qualities and strong risk-adjusted performance.

1 For more information please see the full methodology.

2 Further explanation of the macroeconomic analysis is available in the blog A Historical Perspective on Factor Index Performance across Macroeconomic Cycles.


Introducing the S&P 500 Realized Dispersion Indices

Contributor Image
Anna Mittra

Associate Director, Global Exchanges

S&P Dow Jones Indices

Market participants are continuously seeking innovative tools to better understand market dynamics and manage risk. This week marks the launch of the S&P 500® Realized Dispersion Indices. These indices are designed to measure the historical dispersion of The 500™ over various time periods, providing valuable insights into market volatility and the performance of individual stocks relative to the broader market. They also serve as an analytical complement to the Cboe S&P 500 Dispersion Index (DSPX), which measures implied dispersion over the next 30 days.

Understanding Dispersion and Its Importance

Dispersion is an important statistical measure that quantifies the range of outcomes among the components of an index during a specific period. By evaluating how individual stocks perform in relation to the overall index, it's possible to gain insights into individual patterns and underlying risks.

The S&P 500 Realized Dispersion Indices offer two primary measures: the S&P 500 1-Day Realized Dispersion Index, which reflects historical dispersion over a single trading day; and the S&P 500 30-Day Realized Dispersion Index, which provides insights over a rolling 30-calendar day period. The full universe is used for the S&P 500 1-Day Realized Dispersion Index, while the 30-day version is limited to stocks that remain in the index for the entire rolling period and maintain non-zero weights; corporate actions like spin-offs are excluded to avoid distortions. These indices utilize daily and monthly returns, as well as adjusted close weights of each S&P 500 constituent, alongside the daily and monthly returns of The 500 itself. This comprehensive approach makes it possible for market participants to gain a nuanced understanding of market behavior and the performance of individual stocks.

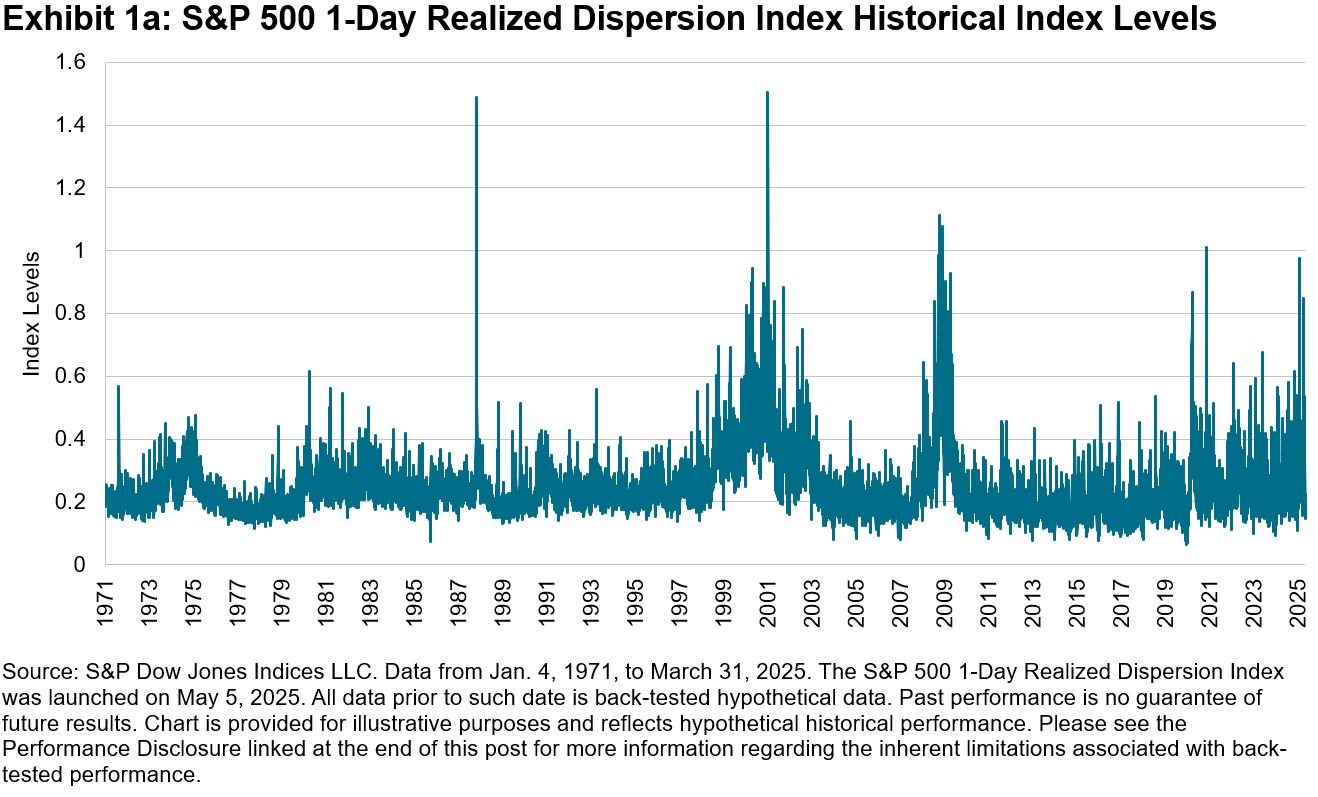
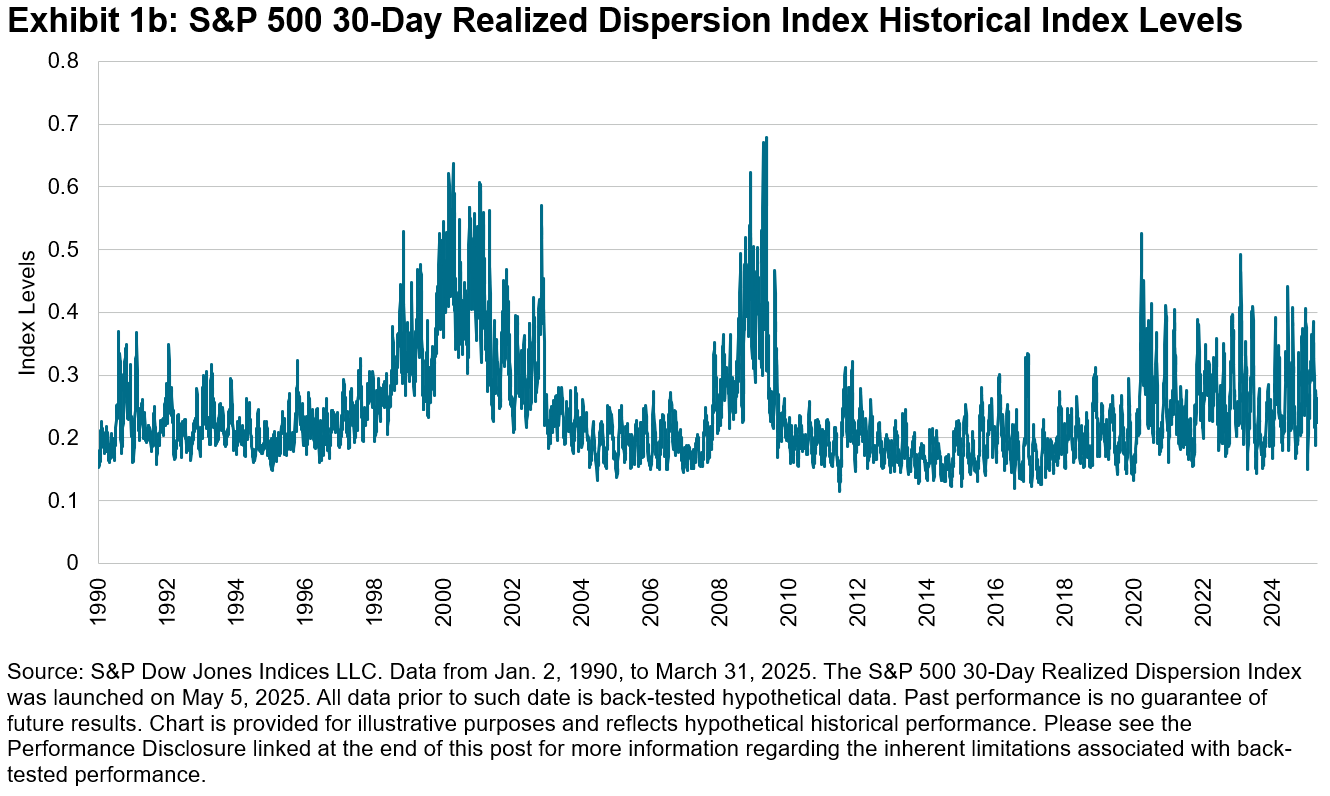
Exhibits 1a & 1b show the historical hypothetical levels of the index over the period for which data is available. The spikes highlight volatile market conditions where individual stocks experienced varying degrees of price movements, which often resulted in greater differences in performance. This divergence in stock returns relative to one another typically manifested as increased dispersion, making patterns and underlying risks across the market easier to observe.

It's useful to highlight the difference between macro volatility and dispersion, particularly through the lens of historical market events. Dispersion reflects how differently individual stocks move from one another, while volatility captures the overall intensity of market movement. Correlation measures the degree to which two securities move in relation to each other. During the Black Monday crash of 1987 and the Dot-Com burst of March 2000, dispersion reached an all-time high as stock performance diverged significantly—some soared while some crashed, driven by lower correlations. In contrast, events like the Global Financial Crisis of 2008 and COVID in 2020 were marked by high volatility and high correlations, where most stocks moved in the same direction. Recognizing these patterns could provide insights into the fundamental drivers of equity market risk and return.

Exhibit 2 compares the S&P 500 30-Day Realized Dispersion Index with the DSPX, highlighting the relationship between historical and implied dispersion over time. Realized dispersion reflects the variability of individual stock returns over the past 30 days, while DSPX reflects the market's expectation for dispersion over the next 30 days. The two series generally moved together but there were notable gaps during periods of heightened uncertainty. These divergences can offer insights into shifts in market sentiment and can help identify when the market overestimated or underestimated future stock return differences.

Conclusion: A Practical Addition to the Investment Analytics Toolkit

The launch of the S&P 500 Realized Dispersion Indices marks a notable development in the tools available to investors seeking to navigate market volatility. By providing a transparent measure of realized dispersion, these indices may help investors better understand the underlying dynamics of risk and return in the U.S. equity market.

For more information on the S&P 500 Realized Dispersion Index Methodology, please refer to the S&P U.S. Indices Methodology, available at www.spglobal.com/spdji.


Tariff Turmoil Shines Spotlight on S&P/ASX Geographic Revenue Exposure Indices

Contributor Image
Sean Freer

Director, Global Exchange Indices

S&P Dow Jones Indices

With the surprisingly widespread U.S. tariff hikes announced by President Trump in early April, the geographic source of corporate revenues is coming under the spotlight, as reciprocal trade agreements are being redrawn globally.

The resulting volatility of share prices following Trump's April 2 "Liberation Day" speech is not surprising, given the globalization and interconnectedness of company revenue sources and supply chains. Some companies are more exposed to a potential trade war than others; for example, those that have products or inputs to products that are highly reliant on foreign markets (such as miners and automakers), while other companies may be more domestically focused (such as banks, telecommunications and utilities companies).

The S&P/ASX 200 Geographic Revenue Exposure Indices offer insight into the performance of Australian companies. The S&P/ASX 200 Australia Revenue Exposure Index includes companies from the S&P/ASX 200 that have greater-than-average revenue exposure to Australia. Conversely, the S&P/ASX 200 Foreign Revenue Exposure Index includes the companies with greater-than-average exposure to markets outside Australia. The indices are weighted by float market cap.1

A Return to Domestic Outperforming

After a lengthy period of underperformance, the S&P/ASX 200 Australia Revenue Exposure Index has reverted to a strong period of outperformance over the past two years. More recently, the S&P/ASX 200 Australia Revenue Exposure Index has outperformed the S&P/ASX 200 Foreign Revenue Exposure Index in each of the first four calendar months of 2025, with April being a watershed month.


The recent strong performance numbers have resulted in the S&P/ASX 200 Australia Revenue Exposure Index outperforming within all the time periods up to the 5-year period ending April 30, 2025, whereas the S&P/ASX 200 Foreign Revenue Exposure Index outperformed over the 10-year period.

Performance Drivers

While trade policy has certainly influenced the short-term price movements, several other factors have influenced longer-term performance, including fluctuations in both currency and interest rates.

The types of companies and sectors represented in each index also help identify performance drivers. The S&P/ASX 200 Foreign Revenue Exposure Index is overweight in companies in the Materials, Health Care and Information Technology sectors relative to the S&P/ASX 200, while the S&P/ASX 200 Australia Revenue Exposure Index is tilted toward the Financials, Real Estate, Communication Services, Consumer Staples and Consumer Discretionary sectors.


Over periods beyond five years, the S&P/ASX 200 Foreign Revenue Exposure Index has outperformed on the back of strong returns within the aforementioned overweighted sectors; Materials, Health Care and Information Technology. Many companies in these sectors have benefitted from a weakening Australian dollar from 2013 to 2022.

However, more recently, a somewhat stabilized exchange rate and the interest rate increases in 2022 and 2023 have supported the large banks, while domestic consumer companies and those in the Real Estate sector have also performed well during the past two years despite cost-of-living concerns.

If we review rolling three-year annualized periods, we can see more clearly the phases in which companies with greater domestic revenue exposure outperformed and vice versa. Since the Australian dollar dropped below 80 cents to the U.S. dollar, the foreign revenue exposure index consistently outperformed the Australian revenue exposure index by more than 5% until about two years ago, when the rising interest rates supported Financials—a large component in the S&P/ASX 200 Australian Revenue Exposure Index.

The S&P/ASX Geographic Revenue Exposure Indices highlight how trade policy, currency movements and interest rates can have a meaningful impact on differing segments of the Australian equity market. The S&P/ASX 200 Geographic Revenue Exposure Indices group constituents as either majority foreign or domestic earners and are a useful lens to analyze market performance during different macro events or stages of an economic cycle.

1 Please refer to the methodology document for S&P Global Revenue Exposure Indices for more information: https://www.spglobal.com/spdji/en/documents/methodologies/methodology-sp-global-revenue-exposure-indices.pdf