Featured Topics
Featured Products
Events
S&P Global Offerings
Featured Topics
Featured Products
Events
S&P Global Offerings
Featured Topics
Featured Products
Events
S&P Global Offerings
Featured Topics
Featured Products
Events
Financial and Market intelligence
Fundamental & Alternative Datasets
Government & Defense
Banking & Capital Markets
Economy & Finance
Energy Transition & Sustainability
Technology & Innovation
Podcasts & Newsletters
Financial and Market intelligence
Fundamental & Alternative Datasets
Government & Defense
Banking & Capital Markets
Economy & Finance
Energy Transition & Sustainability
Technology & Innovation
Podcasts & Newsletters
EQUITIES COMMENTARY — Mar 22, 2022

By Paul Wilson
The evolution of the market post-GFC
The US equity finance market has evolved over the past several years, impacting both hard to borrow shares (HTB) and easier to borrow shares or general collateral (GC). Changes in risk tolerance, regulation and asset flows fundamentally changed the nature of supply and demand for US equities.
In the first section of this note we track the evolution of US equity finance trading as recorded by the IHS Markit Securities Finance dataset. In the second section Eric Lytle will discuss the path Schwab took toward intrinsic value lending and how that has evolved in the period following the Global Financial Crisis (GFC). Following that, we pose some questions for consideration by practitioners.

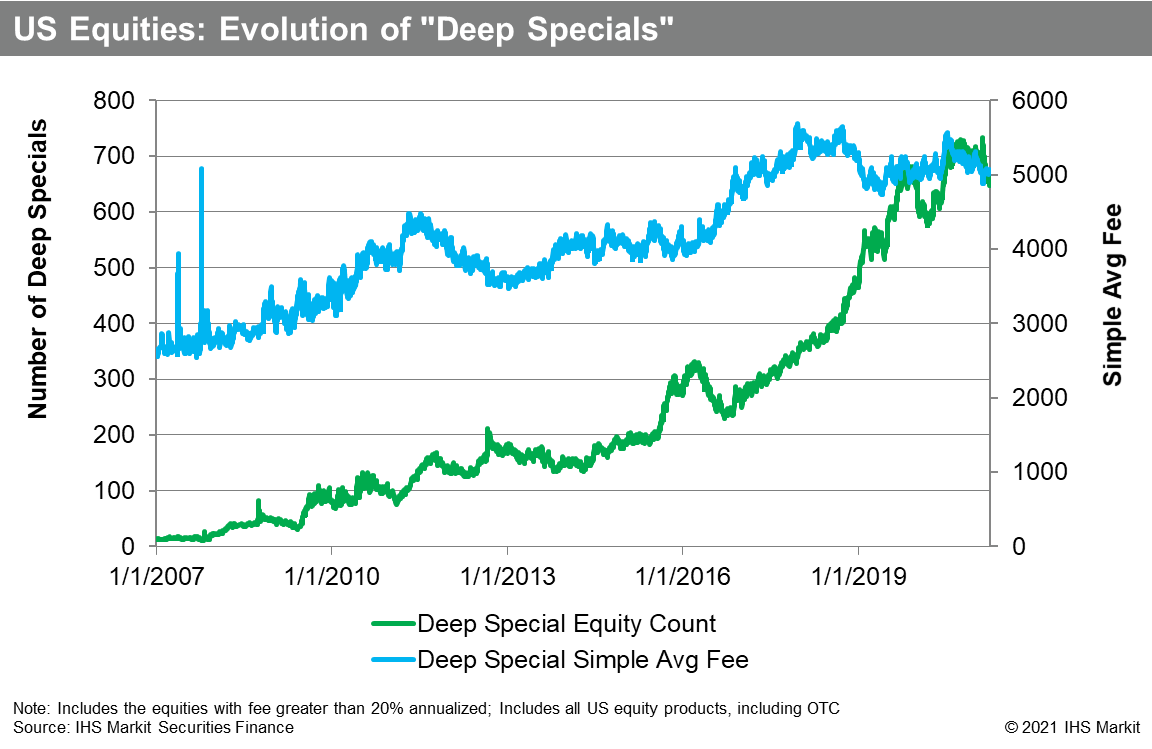
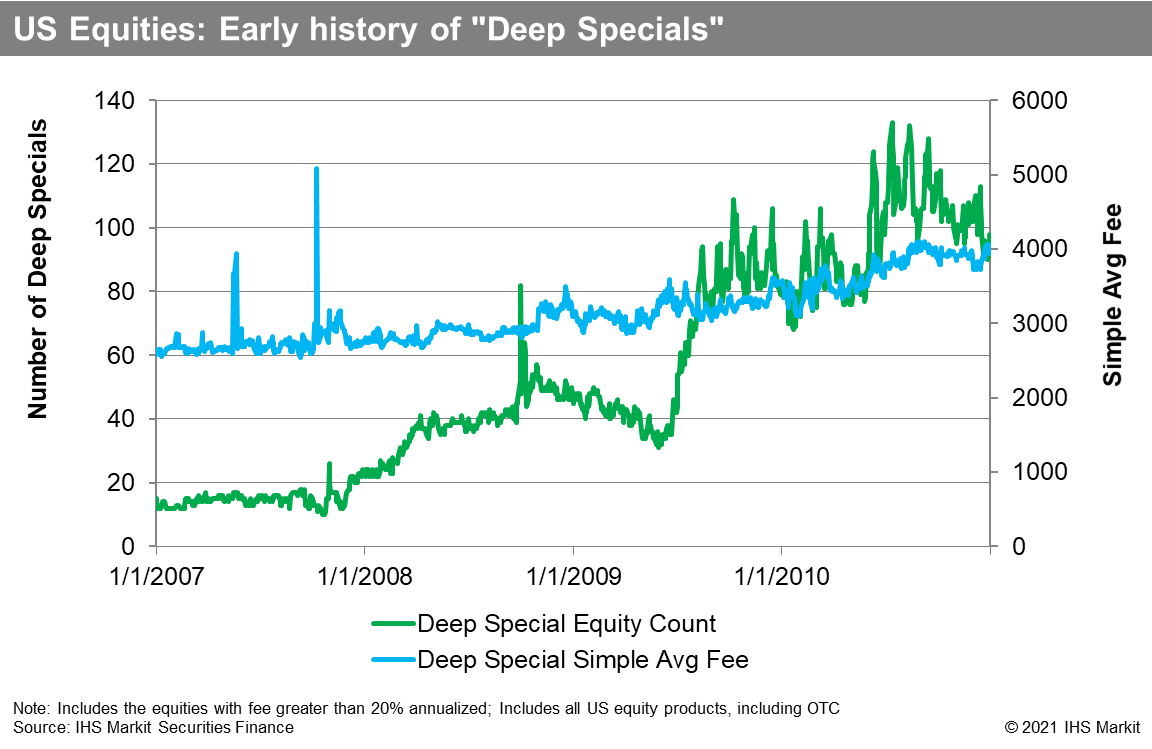
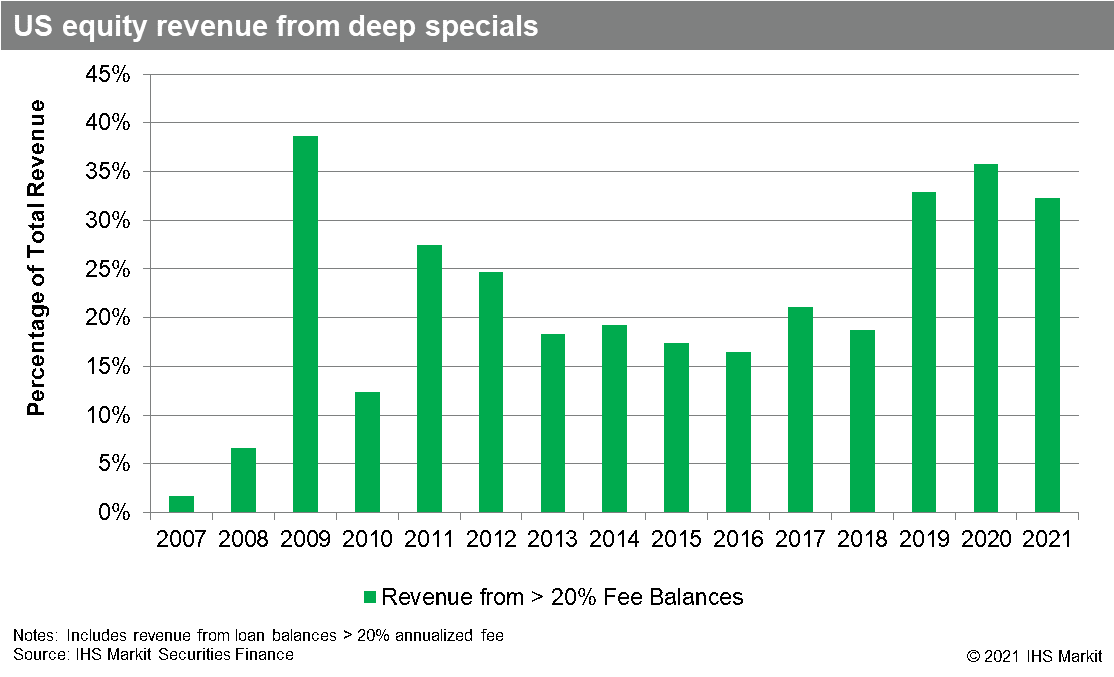
Prior to the Global Financial Crisis in 2008 there were relatively few US equity specials and their revenue contribution was relatively low as compared with the post-GFC period. That was particularly true for deep specials, defined here as equities with a fee greater than 20% annualized. In 2007 the average daily number of US equity deep specials was 15 and the $33m in revenue generated contributed 2% of total US equity revenue. In 2008 the count increased to 40 equities and the contribution more than tripled to 7%. Apart from the growth in specials around the GFC it is interesting to note the stability in 2007, with relatively little change in the number of deep specials prior to fourth quarter of that year.

Prior to 2008 US equity specials, particularly those with fees greater than 2,000 bps, were a relatively small part of total revenue for lenders. In 2007 US equities with average fees greater than 500 bps contributed 27% of total revenue, while shares with greater than 2,000bps contributed only 2% of total revenue. From 2010 to 2020 shares with fees > 500bps contributed 45% of annual revenue on average, while shares with fees > 2,000 bps contributed 22% of annual revenue. To summarize, US equity revenue contribution from all specials increased by 165% in the post-GFC period relative to 2007, while the contribution from > 2,000 bps specials increased by 1317%. A similar image emerges when looking at the percentage of > 500 bps revenue that was generated by the > 2,000 bps shares, which averaged 6% in 2007, 17% in 2008 and 49% for the next 11 years starting in 2010.
Specials did have an impact on equity finance revenues during the GFC, with revenues from > 500 bps balances increasing from 27% in 2007 to 39% in 2008. September 2008 garnered the most revenue for any month on record at that point, a record that would stand until June 2020 (as of this writing the current record is January, 2021). The GFC could be considered the galvanizing event that led the industry into the modern age of specials trading, given that there were relatively few HTB equities prior to 2008 and in terms of count and average fee the trend has been upward since.

In 2009 the Citi recapitalization trade was an outlier, generating more revenue than the rest of the top 20 US equities combined. If Citi were removed from 2009, the contribution of > 2,000bps shares would have been 4%, rather than 39%. Despite the outlier status, the Citi trade did illuminate the potential for substantial engagement around lending into a corporate action related trade for lenders and borrowers.
In 2011 and 2012, the modern age of specials started to emerge, led by Sears Holdings Corp, which was the top US equity earner in both years. While revenue contribution percentage from > 2,000bps specials cooled from 2013 to 2018, the nominal revenue and contribution percentage remained substantially above the pre-GFC level.
The next stage in the evolution of specials trading began with the Beyond Meat IPO in 2019. That also appeared to be an outlier at the time, relating to the low-float, surging share price and lockup expiry. Subsequent IPO lockup expiries and other corporate actions such as warrant redemptions and exchange offers have generated similar eye-popping fees, with 2020 yielding $1.2bn in revenue from > 2,000bps shares; 35% of total revenues.
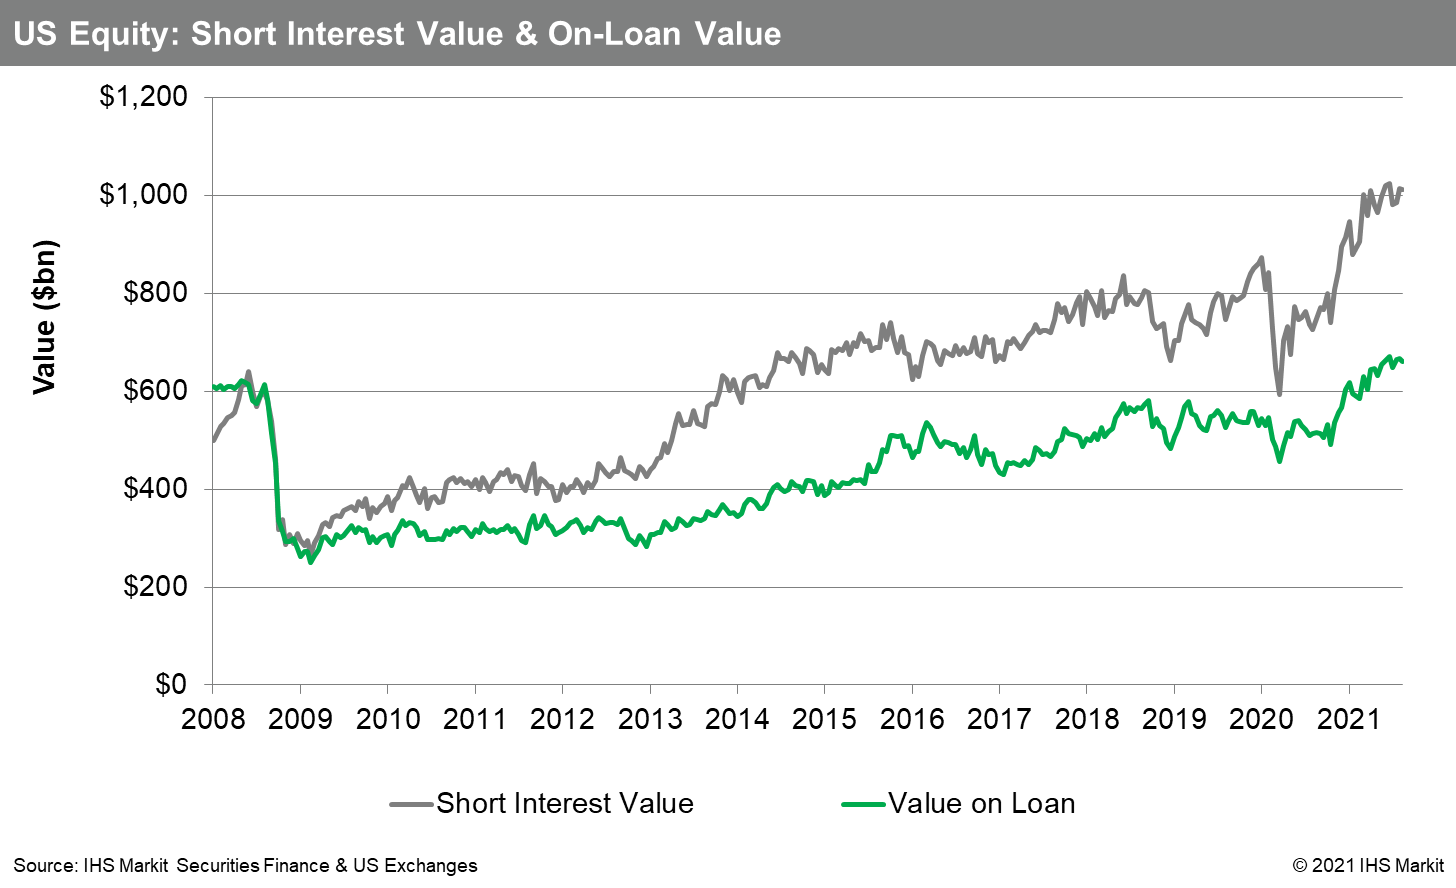
The implications of Basel III and Dodd-Frank were that broker-dealers were best served by maximizing the internal usage of assets. At the same time, hedge fund AUM grew substantially in the three years following the GFC, increasing the assets being financed by prime brokers on the long side. The increased HF long assets reduced the need to borrow in GC shares, with the gap between the short interest and value on loan steadily increasing through present (with occasional pull-backs, most recently observed in March 2020). On March 15, 2021 the gap reached an all-time high of $400bn. This trend encouraged the focus on intrinsic value for lenders, as GC borrow demand failed to keep pace with increasing market valuations, putting pressure on returns to lendable portfolios. It is worth noting that US equity loan balances have not reached a steady balance of the pre-GFC peak of $700bn observed in August 2007 on the heels of the "quant quake", but has touched the milestone twice recently on November 1, 2021 and March, 18, 2022.

Securities finance data vendors emerged from 2005-2013, where prior to that period there were not products which showed industry average borrow fees for hard to borrow names. There were still Hard to Borrow (HTB) shares in that era, but the spread between GC and HTB was lower and the balances above objective "special" thresholds were lower, despite higher total on-loan balances than would be observed for several years post-GFC.
The average fee for shares which were special increased from 2014 onward, meaning for example that if an equity had a fee greater than 500bps it became more likely that it would also be greater than 2,000bps. The increased focus on extracting maximum revenue from hard-to-borrow shares is correlated with the reduced borrow demand for GC, and a causal relationship makes some intuitive sense. The increasing fees for hard to borrow shares reflects the relatively thin proportion of borrow demand for those shares which can be internalized by broker-dealers. Effectively the market is becoming bifurcated between GC and hard-to-borrow, rather than a gradual distribution. This means that HTB shares where there is friction in the borrow can become extremely volatile, which can in turn impact the cash market for trading shares, when one side of the trade is virtually unable to act.
To add a practitioner's perspective, we are pleased to have Eric Lytle from Schwab join the conversation for a Q+A on how the evolution of specials trading looked from the perspective of a retail broker.
How did an intrinsic value lending strategy become the focus for Schwab?
Each US retail broker dealer has its own history and unique path towards intrinsic value securities lending, or hard to borrow shares, and away from general collateral securities lending (GC). Risk return and balance sheet capital considerations all played a part in this decision at Schwab. In a simple sense you could think of the percentage of revenue generated per dollar of loan exposure, the highest fee loans will generate many multiples of the revenue for GC loans.
Circa 2003/2004, before the dawn of the special's era in 2008, Schwab had begun the move away from the then popular GC to HTB ratio lending model and began the move towards an HTB only lending model. At the time, this move was done primarily to reduce the securities lending impact on the balance sheet. The results were astonishing: across the board risk factors (counterparty credit, collateral re-investment, operational and settlement) were reduced by 90% and revenue improved by 400%. The risk reduction was anticipated partly based on the reduction in large dollar value GC loan balances, but the increase in total revenue was a revelation. The path forward was clear - focus on improving revenues and reducing risks by getting better at lending HTB securities.
So, we see the ball was rolling toward intrinsic value prior to the GFC, how did that period impact the lending strategy at Schwab?
The global financial crisis laid bare that there is risk associated with the collateral re-investment risk, as distinct from the counterparty credit risk - assuming lenders manage the counterparty credit risk with overcollateralization (i.e., 102% marked up to nearest whole dollar) and/or utilize a Central Counterparty (CCP) clearing house. When Lehman went under, Schwab had exposure, but it was essentially a non-event because the collateralization amounts were more than sufficient to be made whole and we had not used the collateral re-investment pool to increase the securities lending return. Schwab cannot take the full credit for the conservative re-investment approach, which was also due in part to the customer protection rule 15c3-3 which guides the way broker dealers can invest the collateral received in connection with lending customer securities.
How do you think that re-assessment of risk translated into market operations?
The GFC drove a reconsideration of the risks associated with all aspects of lending, in particular collateral reinvestment. At Schwab we gave collateral reinvestment a higher risk weighting post-GFC, as did the rest of the industry. The reduced desire to take credit and duration risk in reinvestment portfolios was one driver of increased industry focus on HTB, though as I've mentioned this was not a new opportunity based on our experience pre-GFC, it just became more attractive based on total revenue potential as well as relative risk-capital requirement compared with collateral reinvestment.
If counterparty credit can be managed with collateral mark parameters, then we all simply have to assess the value proposition of paying for counterparty credit indemnifications (insurance against default) and providing additional collateral to CCPs to improve the credit rating and to guarantee the safe return of securities and collateral. Schwab is supportive of CCPs, because in our opinion they can offer more than just counterparty credit mitigation, in the form of centralizing common services, such as security master, pricing, marks, and in the future state for the CCPs, both the Options Clearing Corporation (OCC) and the National Securities Clearing Corporation (NSCC) SFT will assist in collecting payable/receivables, corporate actions processing and life cycle event matching - these centralized services will go a long way to increasing post trade efficiencies and reducing operational costs. For HTB trades the value of the loan is substantial enough that I feel an appropriate overcollateralization via a CCP ought to be able to do away with the need for indemnification, which would reduce overall costs.
How did Schwab get better at lending HTB securities post-GFC?
Schwab committed to adopting technologies and vendors that helped us connect with our trading partners in automated and efficient ways. We had to objectively assess our trading and time management skills. At the start of each day, Schwab has approximately 45k open contracts, 15k unique lendable securities with 5k unique securities on loan. The question we had to ask ourselves was, "how do you manage that book of business manually over the phone or via email/chat?" The answer we came to was, "you cannot manage it well". The first step was to understand the appropriate rates for new loans and for the weighted average rate for your book on that same security. The Schwab team, and I think Sai-Kit Chan deserves named credit, built a rate algorithm that took in lending data feeds from the main vendors, added in several market variables and came up with a single tradeable rate output that allowed us to comfortably pursue trade automation. Next, we decided to automate trading in the securities that do not have a lot of rate or price volatility and make up 90% of our daily transactions and only 10% of our revenue. This gave our traders the time to focus on a much smaller list of securities that generates 90% of lending revenue - the 90/10 rule. The rate algo is a living breathing product that incorporates new variables to track trends, calculate intra-day updates and improve predictive abilities. The predictive ability helps us to improve our entry points on trades so that there is less friction on the re-rate dance between lenders and borrowers.
The intrinsic value focus has increased across the market over the last 10 years, which has led to some spectacular lending opportunities, but that has also come with boom-bust periods such as the most recent Dec/Jan boom followed by Feb/March bust, followed by another boom in June, do you have any comment on the health of the market for lending specials?
The increasing occurrences of extreme rates and price shocks give me concerns about the health of the securities lending market. In addition to the macro reasons you have stated in this note, I believe there are two main micro contributing factors to the increase in volatility and a decrease in stability and rate band predictability, 1) barriers to entry in the fully paid market reduce the supply of lendable stock in some of the hardest to borrow names and 2) the antiquated locates to short sale authorization process which makes it possible for more short sale executions than the market can handle by the time we get to settlement day on T+2. The result is short cover buy-ins, increased rate volatility, increased stock price volatility, decreased short trade exposure economic predictability which leads to lower short/borrow demand and less price discovery in the market overall.
Do you have any areas for consideration as market conditions evolve and as the SEC proposes new rules to mandate transparency?
This is clearly a time of innovation and forward thinking, which is exciting, and a great time to ask big questions. Relating to the concerns I raised around market volatility and sustainability, I would pose these questions to the market:
In my opinion the answer to these questions is yes, and it requires a centralized and transparent marketplace solution.
As the US equity market generates an increasing share of revenue from specials the need for transparency and operational efficiency has also increased as seen from the recently proposed rules from the SEC. The variability in lending rates makes it difficult for the buy side to manage short positions. On the other side the decline in GC demand relative to supply has put pressure on lender portfolio returns, making the capture of intrinsic value in lendable portfolios more important than ever. In a sense, US equity lenders hold a portfolio of deep out of the money options; the present value of each GC lendable share is low, but collectively the portfolio is likely to have some amount of explosive upside value when shares trade special. If lenders do not monetize the optionality via portfolio exclusives or realize the upside value by pushing rates as hard as possible on the limited special opportunities, their returns will be based on total supply and demand dynamics, which have not been favorable to lenders post-GFC. The rejoinder from the borrower side may be that pushing on special rates chokes borrow demand, but then the question becomes what amount of sacrifice is required for market stability and how can that be measured? On a related note, equity put options are increasingly liquid and have an embedded term borrow which reduces the uncertainty around rate fluctuations. On the Q1, 2021 securities finance webinar Carson Block CIO, Muddy Waters Capital LLC. noted the increased use of put options for his short portfolio, something which he said would have been difficult or impossible prior to the increased liquidity observed since the start of 2020. There may be structural changes which would better facilitate the realization of intrinsic value with lower volatility, evaluating those options is paramount for market participants as the industry evolves to meet the challenges of the modern US equity market.
Posted 22 March 2022 by Paul Wilson, Manging Director, Securities Finance, S&P Global Market Intelligence
S&P Global provides industry-leading data, software and technology platforms and managed services to tackle some of the most difficult challenges in financial markets. We help our customers better understand complicated markets, reduce risk, operate more efficiently and comply with financial regulation.
This article was published by S&P Global Market Intelligence and not by S&P Global Ratings, which is a separately managed division of S&P Global.