Featured Topics
Featured Products
Events
S&P Global Offerings
Featured Topics
Featured Products
Events
S&P Global Offerings
Featured Topics
Featured Products
Events
S&P Global Offerings
Featured Topics
Featured Products
Events
Financial and Market intelligence
Fundamental & Alternative Datasets
Government & Defense
Banking & Capital Markets
Economy & Finance
Energy Transition & Sustainability
Technology & Innovation
Podcasts & Newsletters
Financial and Market intelligence
Fundamental & Alternative Datasets
Government & Defense
Banking & Capital Markets
Economy & Finance
Energy Transition & Sustainability
Technology & Innovation
Podcasts & Newsletters
14 Sep, 2017 | 12:52
Highlights
Wonder what the impact could be once MSCI includes China A-Shares in the MSCI Emerging Market Index in June 2018? Learn more from our simulation study as we examined country and sector weights, valuations, performances, and styles of 222 proposed A-share names in the index for the past five years.
Based on the recent announcement by MSCI(1) on China A-shares inclusion into the MSCI Emerging Market (EM) Index, we first conducted a simulation analysis where we assumed that the 222 proposed A-share names were gradually included into the MSCI EM Index for the past five years, at the pace of 5%/ 15% / 30%/ 60%/ 100% from year 2012 to 2016.
We looked at transitions in terms of country/sector weights, valuations, performance, and styles to gain further insights from such inclusion.
We then followed up by comparing the MSCI China A-share Large Cap Index vs. the MSCI China H-share using our proprietary Alpha Factor Library Styles, ran attribution analysis grouped by those style discrepancies, and offered some China A-shares as potential candidates to be considered for portfolios that currently contained H-shares, but are considering to add A-shares in anticipation of their gradual additions to the MSCI EM Index.
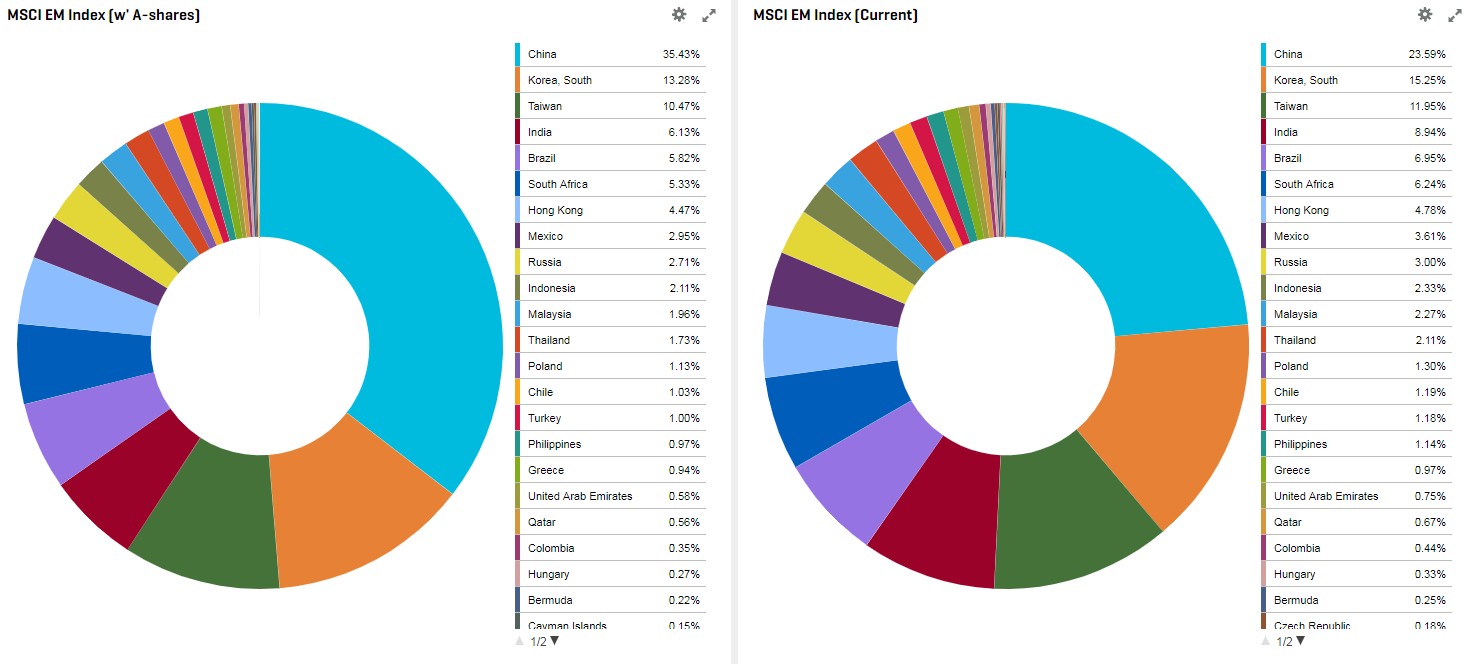
By utilizing our portfolio analytics and reporting tools, we are able to observe that China has indeed lifted its weight to 35.4% from its previous 23.6% from the MSCI EM Index. Including Hong Kong, its Greater China contribution comes to approximately 40% after the full inclusion. Similarly, South Korea now contributes to 13.3% vs. a prior 15.3%, where Taiwan and India continue to hold their third and fourth places contributing 10.5% and 6.1% weights in the EM Index, respectively.
Chart 1. Composition by Country Weight
Source: Portfolio Analytics, S&P Capital IQ platform as of July 31, 2017
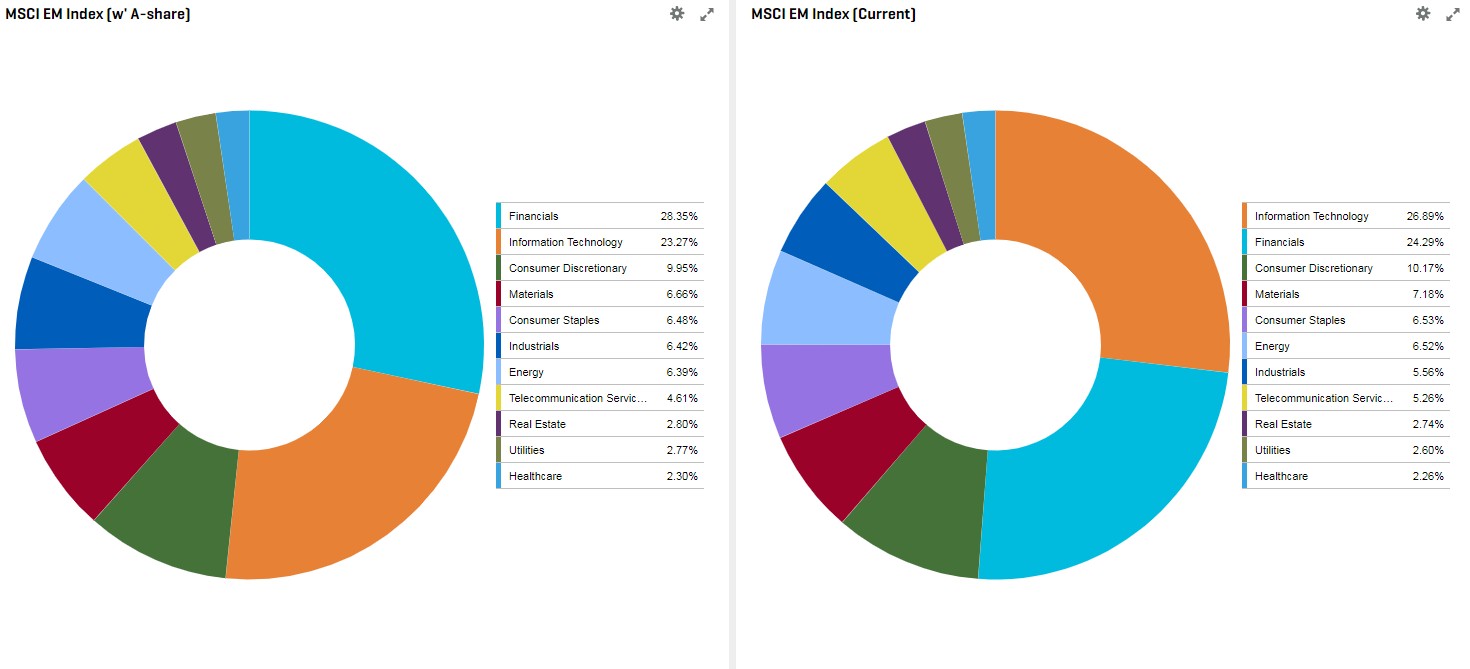
When we analyzed the make-up of the simulated MSCI EM Index (with A-share inclusion) vs. the current MSCI EM Index, we noticed that the simulated EM Index is of similar sector composition vs. the original EM index. However, financials now makes up the largest composition of the index with 28.4% of the total weight, climbing ahead of information technology, which reduced its contribution from 26.9% to 23.3%.
Chart 2. Composition by Sector Weight
Source: Portfolio Analytics, S&P Capital IQ platform as of July 31, 2017
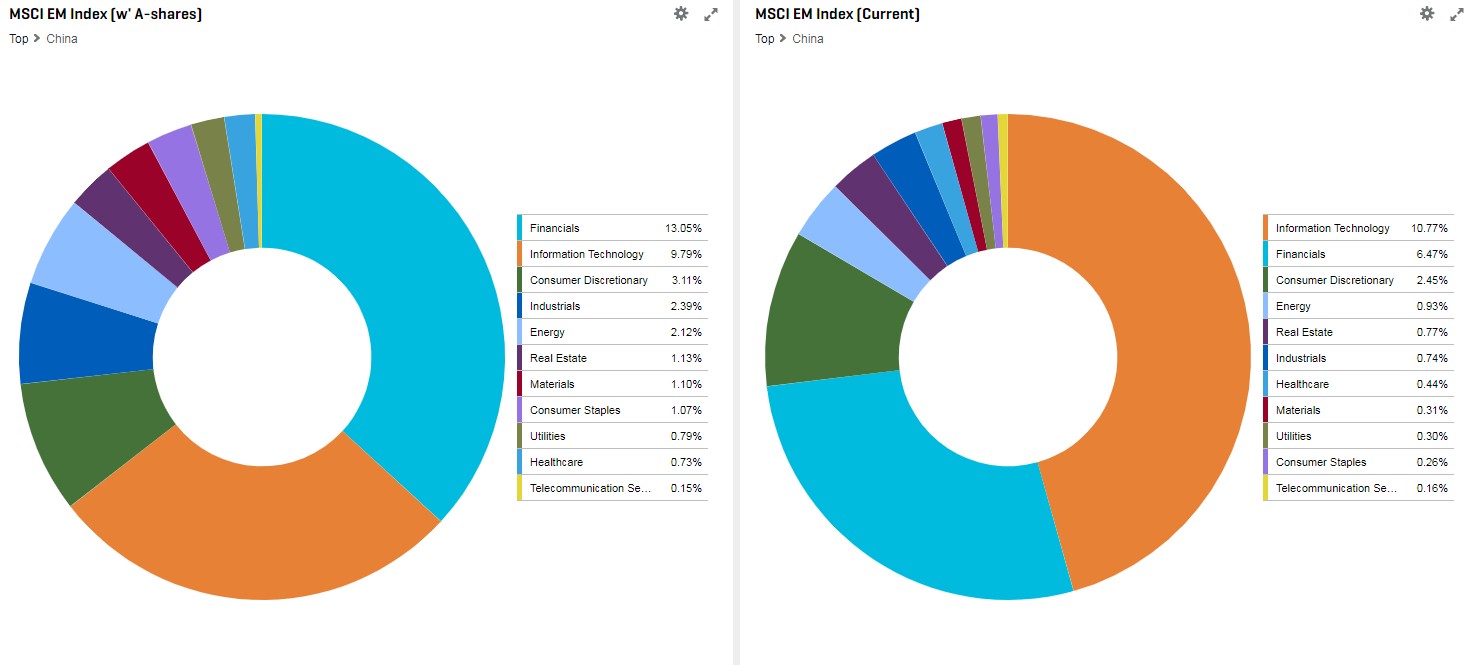
Zooming in on China, we also found the simulated MSCI EM Index is more sector diversified. While financials and information technology still make up the majority of the weight, they now only contribute 13.05% and 9.8%, respectively, to China’s 35.4% of the simulated EM Index, compared to the current 6.5% and 10.7% to China’s current 23.6% of the index. Sectors such as industrials and energy took a much more distributed share compared to before the A-share inclusion.
Chart 3. Composition by Sector Weight - China
Source: Portfolio Analytics, S&P Capital IQ platform as of July 31, 2017
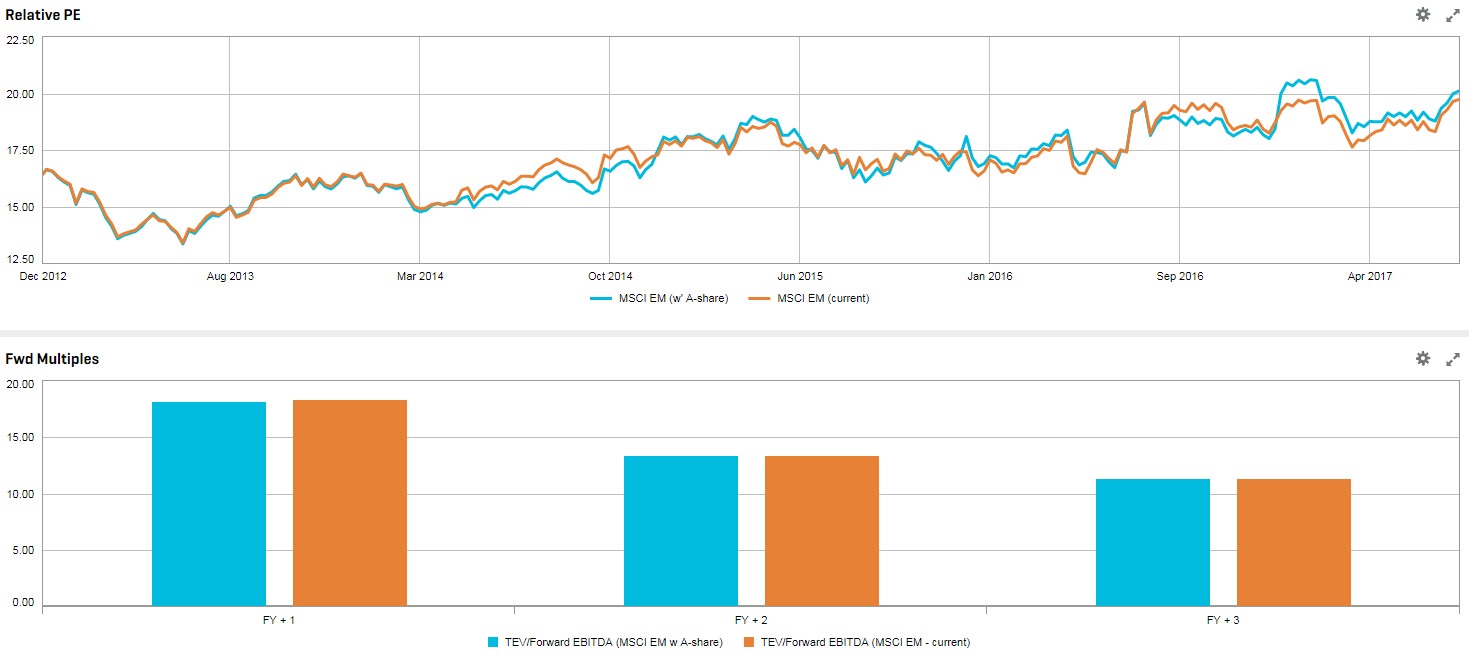
By comparing the new MSCI EM Index with A-shares inclusion to the current EM Index, the new index has a higher valuation in terms of P/E at times, particularly starting the end of 2016, when the A-share market was anticipating another wave of market liberalization. Looking ahead, forward multiples e.g., EV/EBITDA for the next three financial years are quite in-line for the new EM index vs. the pre-A inclusion.
Chart 4. Forward Multiples and P/E
Source: Portfolio Analytics, S&P Capital IQ platform as of July 31, 2017
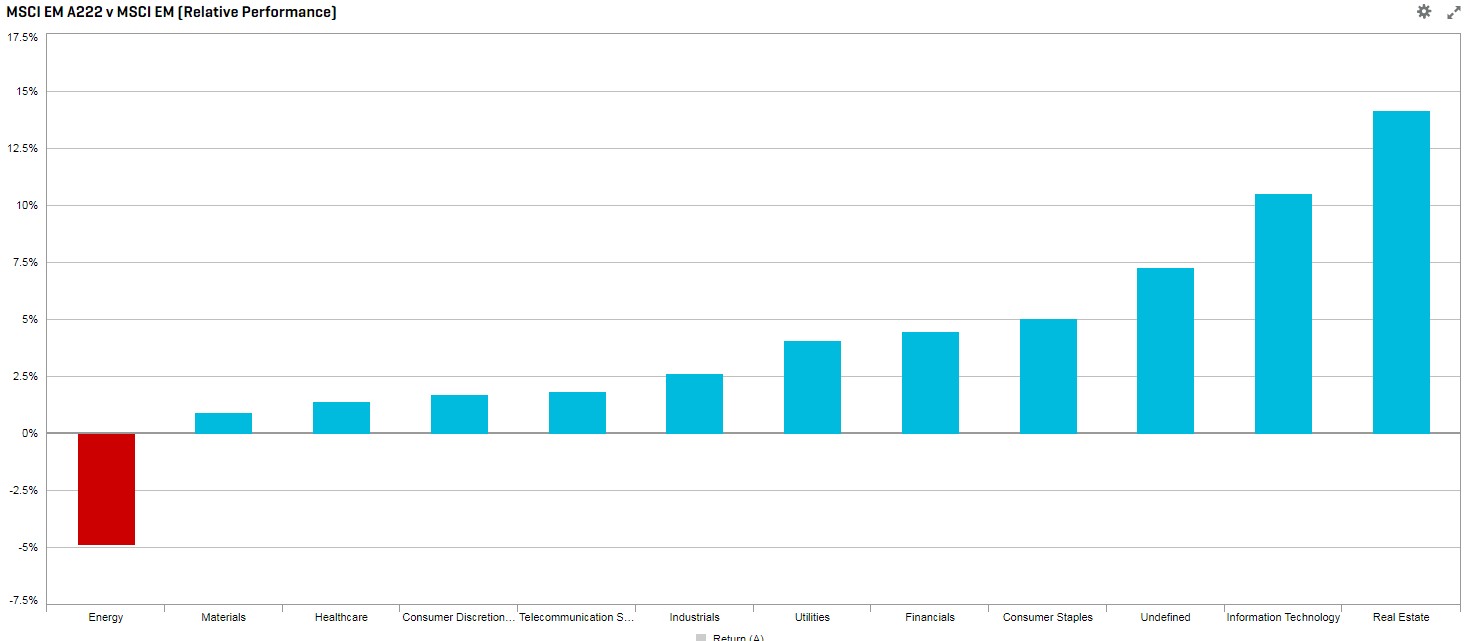
The active performance analysis below shows us that most of the sectors from the MSCI EM Index (with A-share inclusion) would have outperformed the current MSCI EM Index, if the 222 China-A shares were progressively included into the index since the end of 2012. The biggest alpha came from the real estate sector, followed by information technology, with active returns of 14.2% and 10.5% recorded, respectively. The only sector that would have underperformed is energy.
Chart 5. Relative Performance
Source: Portfolio Analytics, S&P Capital IQ platform as of July 31, 2017 Past performance is no guarantee of future results. Indexes are unmanaged, statistical composites. It is not possible to invest directly in an index.
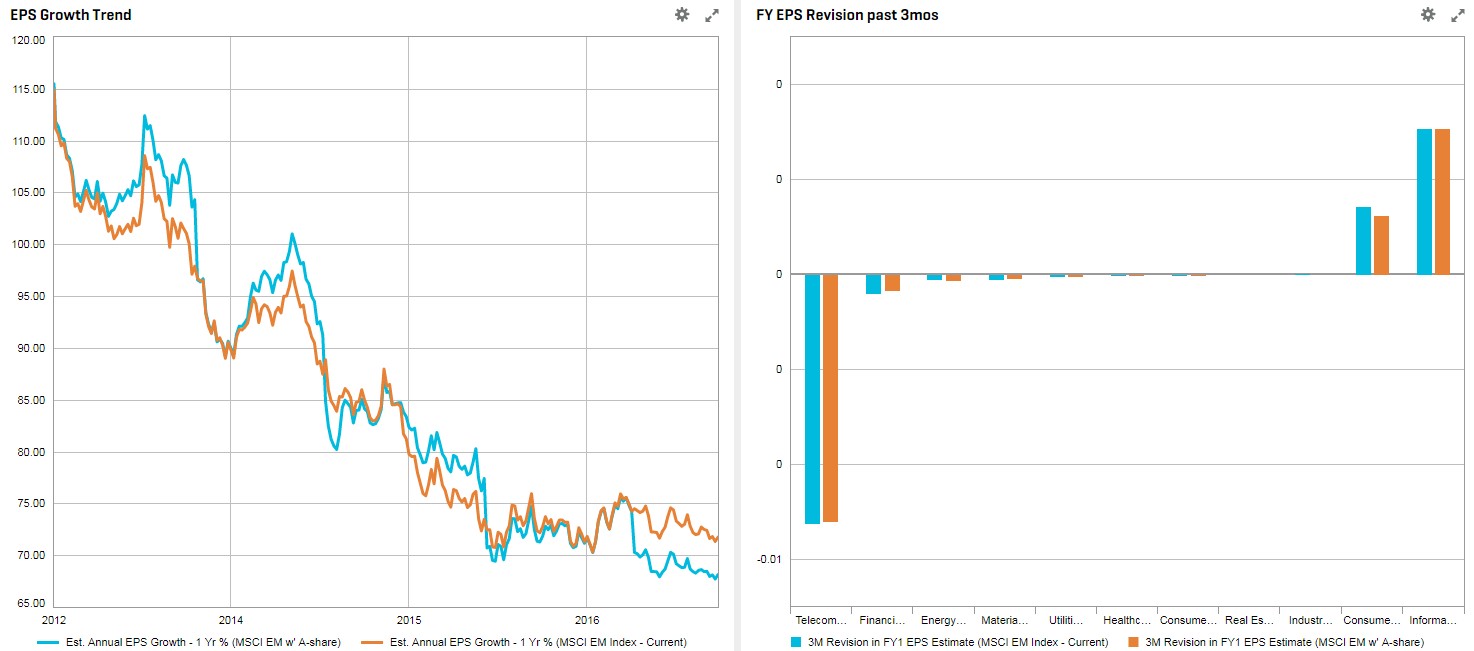
Sell-sides were generally more optimistic toward the simulated index - estimated 1Yr EPS growth was ~7% higher vs. the original EM Index during different periods. However, forecasted numbers have also come in quite in-line throughout the years. We also witnessed EPS downgrades specifically in telecom. services, financials, and energy for the new EM index. Meanwhile, the magnitude of upgrades tends to be a bit stronger for the new EM Index for the consumer discretionary sector.
Chart 6. Sell-sides Forecasts
Source: Portfolio Analytics, S&P Capital IQ platform as of July 31, 2017
By running attribution analysis on the MSCI EM Index (with A-share) vs. the original EM Index for almost the last five years ending on July 31, 2017, we noticed that the index with A-share outperformed the original EM Index by 2.35%. Most of the outperformance came from selection from the information technology, financials, consumer staples sectors.
Chart 7. Sector Attribution
Source: Portfolio Analytics, S&P Capital IQ platform as of July 31, 2017 Past performance is no guarantee of future results. Indexes are unmanaged, statistical composites. It is not possible to invest directly in an index.
All of the above comparisons were done using a simulated index assuming 222 proposed A-share names were gradually transitioned into the MSCI EM Index for the past five years, at the pace of 5%/ 15% / 30%/ 60%/ 100% from 2012 to 2016. Then, we wanted to take it one step further to see what would happen if we started to include MSCI Class A-shares into a portfolio containing Class H-shares. What would be some of the criteria we could use to identify good candidates?
Based on the announcement and our due diligence, we feel a comparison of the MSCI China A Large Cap Index, which covers the 70% ± 5% market cap of the China A investible universe, is a more suitable universe than the standard MSCI China A Index, which covers an additional 10% of the smaller cap universe.
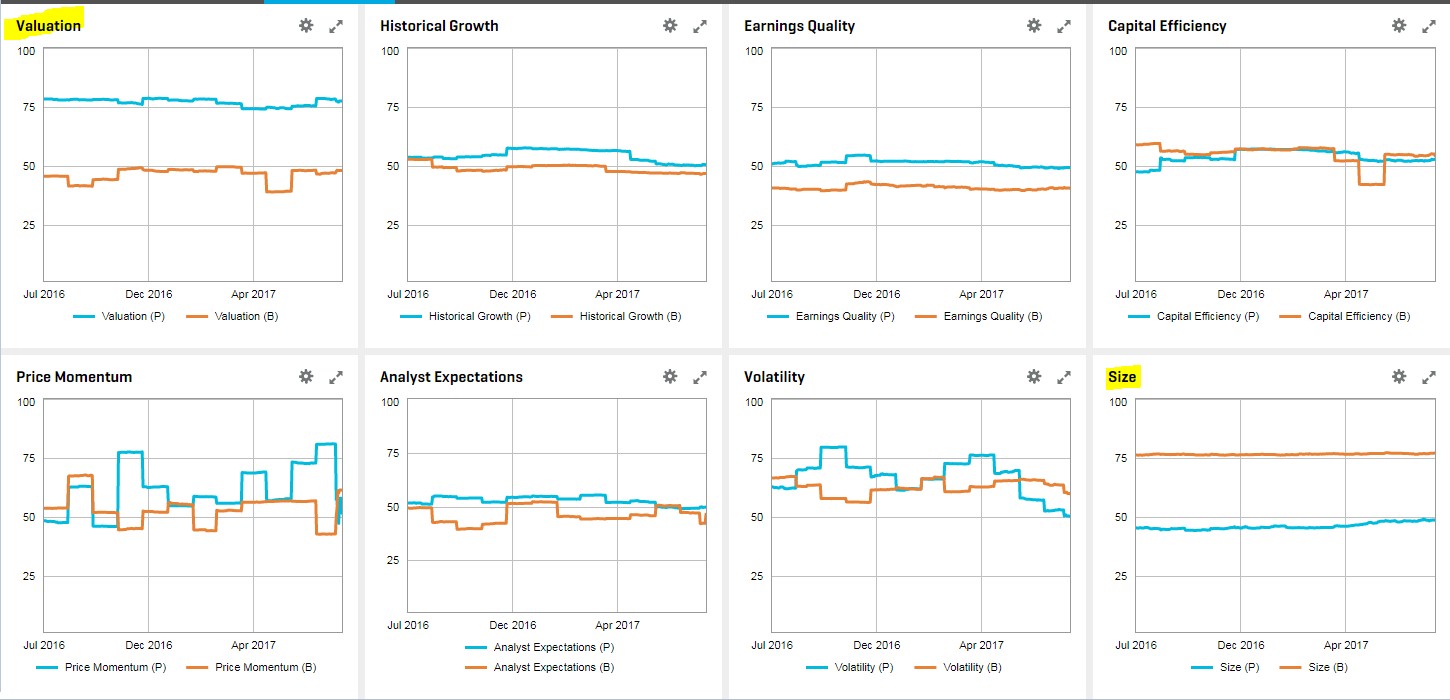
We first ran a style comparison analysis using our proprietary Alpha Factor Library (AFL) styles of that index vs. the MSCI China H-share for the most recent one-year time period and noticed that the biggest and persistent discrepancies occurred in styles valuation and size:
Chart 8. Alpha Factor Library Style Time Series Comparison Charts
Source: Portfolio Analytics, S&P Capital IQ platform as of July 31, 2017
We then conducted return analysis for the same one-year period, but grouped using our proprietary AFL Valuation and Size style factors. We noted the positive contributions for the Lowest Valuation and Largest Size groups.
Chart 9. Return Analysis Based On Valuation Groupings
Source: Portfolio Analytics, S&P Capital IQ platform as of July 31, 2017.Past performance is no guarantee of future results. Indexes are unmanaged, statistical composites. It is not possible to invest directly in an index.
Chart 10. Return Analysis Based On Size Groupings
Source: Portfolio Analytics, S&P Capital IQ platform as of July 31, 2017. Past performance is no guarantee of future results. Indexes are unmanaged, statistical composites. It is not possible to invest directly in an index.
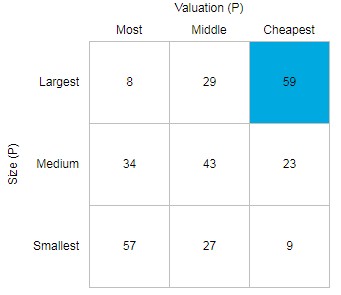
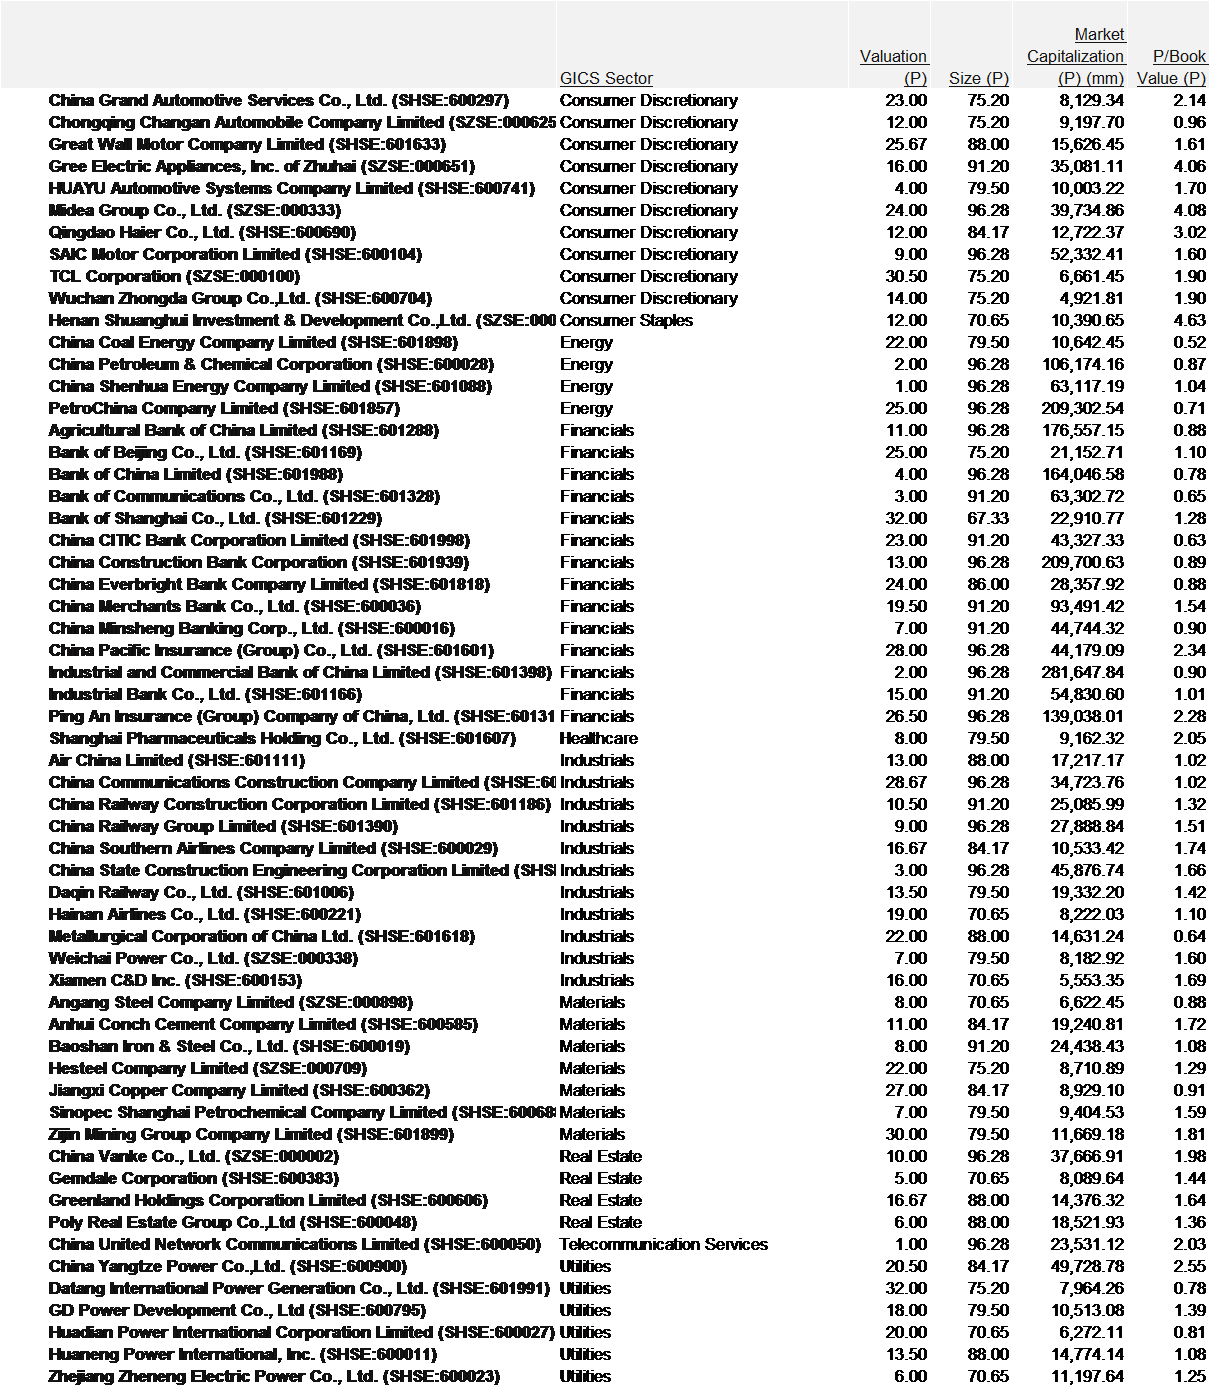
We then used our Style Chart to determine the 59 constituents that were ranked in the bottom 1/3 on AFL Valuation style and largest 1/3 on AFL Size style. Please see the appendix for the list of those 59 constituents grouped by GICS Sectors.
Chart 11. Valuation x Size Style Breakdown
Source: Portfolio Analytics, S&P Capital IQ platform as of July 31, 2017
Want to learn more about the tools that the authors highlighted in this piece? Request a demo.

