Featured Topics
Featured Products
Events
S&P Global Offerings
Featured Topics
Featured Products
Events
S&P Global Offerings
Featured Topics
Featured Products
Events
S&P Global Offerings
Featured Topics
Featured Products
Events
Financial and Market intelligence
Fundamental & Alternative Datasets
Government & Defense
Banking & Capital Markets
Economy & Finance
Energy Transition & Sustainability
Technology & Innovation
Podcasts & Newsletters
Financial and Market intelligence
Fundamental & Alternative Datasets
Government & Defense
Banking & Capital Markets
Economy & Finance
Energy Transition & Sustainability
Technology & Innovation
Podcasts & Newsletters
Blog — 31 Mar, 2022
Highlights
The Machine Readable Filings (MRF) dataset can be used to extract insights aimed at identifying excess returns.
An overview of Machine Readable Filings (MRF) and the tools necessary to extract insights are provided through a simple use case aiming to find excess returns.
10-K and 10-Q forms from the MRF dataset are leveraged to create a sentiment-based signal emanating from the metric’s quarterly changes.
Context of Strategy
Following S&P Global Market Intelligence release of the new Machine Readable Filings (MRF) dataset in 2020, several papers[1][2] were published by the Quantamental Research team. Said papers zoomed in on the strong relationship between historical consistency in commonly shared sections of forms 10-K and 10-Q, and companies’ performance as measured by their historical stock prices.
From the perspective of an additional use case, the focus of this exercise is to showcase an example of an investment management workflow wherein sentiment analysis techniques are applied to the 10-K and 10-Q filings in a manner analogous to the already available Textual Data Analytics product. To that purpose, a simple historical strategy simulation is run with the goal of attempting to generate excess returns relative to the S&P 1500 and S&P 500 benchmarks between 2007 and June 2021.
Machine Readable Filings
The dataset is comprised of textual data sourced from publicly traded companies’ filings to the U.S. Securities and Exchange Commission (SEC) with a starting date of 2006. Its value-add proposition is to facilitate the parsing of textual data by providing:
A Simple Investment Strategy
What does it entail to leverage Machine Readable Filings (MRF) in an investment management workflow?
Natural language Processing[3] (NLP) is leveraged to transform and quantify the MRF dataset, wherein the Loughran-McDonald Master Dictionary is chosen to support this paper’s sentiment-based analysis[4] It should be noted that this is also the dictionary used in the Textual Data Analytics (TDA) product built using the Machine Readable Transcripts dataset.
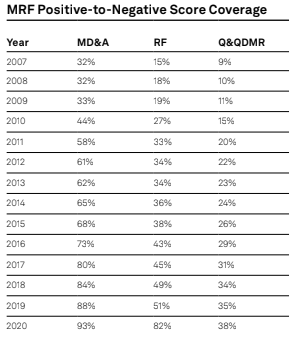
In this example, the positive-to-negative metric, one of many within the bag-of-words category of sentiment-based signals is selected. Though the suite of tools[5] used to perform these analyses permits to assess the efficacy of several dozens of metrics, for simplification purposes the focus in this document is solely on the positive-to-negative metric[6]. As the initial step, the metric’s coverage is reviewed for the available common document sections as measured by quarterly averages per year using the S&P 1500 as the universe[7].
While the Management Discussion & Analysis (MD&A) and the Risk Factors (RF) sections are selected, the Quantitative and Qualitative Disclosures about Market Risk (Q&QDMR) section is excluded given the limited section’s coverage.
Using the positive-to-negative scores for the aforementioned sections, a logic is built to calculate companies’ quarter-over-quarter percentage changes on the positive-to negative scores. Moreover, to avoid look-ahead bias, we ensure that the associated sentiment scores are as of companies’ filing dates.
Next, utilizing the positive-to-negative signals, the following strategy is simulated on both the S&P 1500 and S&P 500 for each section (MD&A and RF) separately:
Portfolio Results
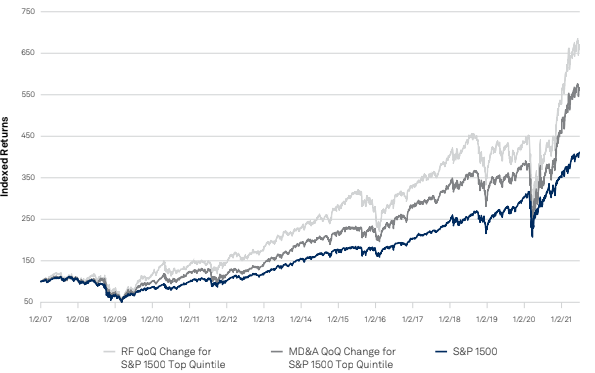
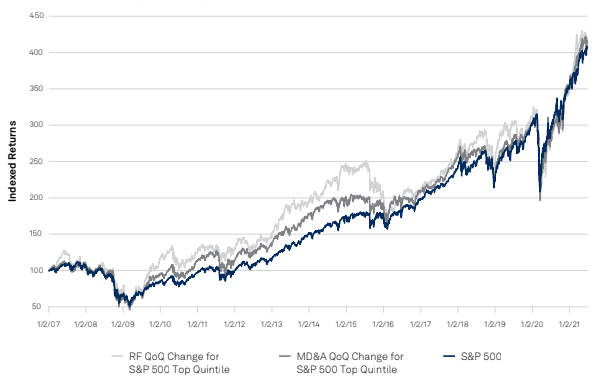
The simulated strategies for period 2007 through June 2021 outperform the S&P 1500 as a benchmark:
MRF Pos-To-Neg Strategy vs S&P 1500

MRF Pos-To-Neg Strategy vs S&P 500

Summary
This document described the steps to leverage the Machine Readable Filings dataset for creating a signal to guide a simple investment strategy.
The exposed use case was purposefully simple and of narrow focus but revealed the ability of generating excess returns.
Readers may attempt replicating this strategy. The implementation addressing the NLP requirements to produce the selected metric used in this document is available upon request. Alternatively, a sample and customizable open-source code may be explored as a starting point. Said code is available via the S&P Global Marketplace Workbench.
Overall, the ever-expanding NLP dictionaries and techniques, coupled with MRF’s large number of investment management applications, makes this dataset a valuable proposition to practitioners, either as the sole driver or to complement existing strategies.
References

CONTACT US
The Americas
+1-877-863-1306
Europe, Middle East & Africa
+44-20-7176-1234
Asia-Pacific
+852-2533-3565
About S&P Global Market Intelligence
At S&P Global Market Intelligence, we understand the importance of accurate, deep and insightful information. We integrate financial and industry data, research and news into tools that help track performance, generate alpha, identify investment ideas, perform valuations and assess credit risk. Investment professionals, government agencies, corporations and universities around the world use this essential intelligence to make business and financial decisions with conviction. S&P Global Market Intelligence is a division of S&P Global (NYSE: SPGI), the world’s foremost provider of credit ratings, benchmarks and analytics in the global capital and commodity markets, offering ESG solutions, deep data and insights on critical business factors. S&P Global has been providing essential intelligence that unlocks opportunity, fosters growth and accelerates progress for more than 160 years. For more information, visit www.spglobal.com/marketintelligence.
[1] Yang, Z., and Oyeniyi, T. “Hiding in Plain Sight — Risks That Are Overlooked.” S&P Global Market Intelligence Quantamental Research March 2021.
[2] Zhao, F. “U.S. Filings: No News is Good News, Textual Consistency in Corporate Filings Signals Outperformance” S&P Global Market Intelligence Quantamental Research May 2021.
[3] A comprehensive demystifying exercise on what NLP is and how it can be used is carried out at Zhao, F. “Natural Language Processing — Part I: Primer” S&P Global Market Intelligence Quantamental Research, September 2017.
[4] As described in S&P Global Market Intelligence TDA User Guide, the Loughran-McDonald Master Dictionary is the de facto financial dictionary for NLP analysis due to its accessibility, its comprehensiveness, its financial-specific context, its lack of dependency on transitory words, and lastly, its less ambiguous and singularly connoted words.
[5] For production purposes, scores for sentiment-based signals were generated using a combination of Alteryx and Python, which is available upon request. Alternatively, sample code using open-source software is also available for execution and manipulation via S&P Global Marketplace Workbench. Sample code addresses the selected metric and should be a close approximation, if not identical. See references for details.
[6] The definition of the Positive-to-Negative is as follows: If NEGATIVE > 0, then [POSITIVE] / [NEGATIVE] else -1.
[7] See references for values. Values applicable based on dataset, universe, and embedded process. Analyzed sections were limited to the score availability through the production solution.
[8] MD&A of S&P 1500: Annual rate of return is 12.64%, vs S&P 1500 10.25%.
[9] MD&A of S&P 1500: Realized standard deviation is 24.80%, vs S&P 1500 20.78%.
[10] RF of S&P 1500: Annual rate of return is 13.95%, vs S&P 1500 10.25%.
[11] RF of S&P 1500: Realized standard deviation is 26.75%, vs S&P 1500 20.78%.
[12] MD&A of S&P 500: Annual rate of return is 10.30%, vs S&P 500 10.21%.
[13] MD&A of S&P 500: Realized standard deviation is 23.93%, vs S&P 500 20.59%.
[14] RF of S&P 500: Annual rate of return is 10.34%, vs S&P 500 10.21%.
[15] RF of S&P 500: Realized standard deviation is 25.75%, vs S&P 500 20.59%.