IN THIS LIST

U.S. Persistence Scorecard Year-End 2019

Australia Persistence Scorecard: Year-End 2019

SPIVA® Canada Scorecard Year-End 2019

Latin America Persistence Scorecard May 2020

Risk-Adjusted SPIVA® Scorecard: Year-End 2019

U.S. Persistence Scorecard Year-End 2019

Contributor Image
Berlinda Liu

Director, Multi-Asset Indices

SUMMARY

When an active manager beats a benchmark, how can we judge whether the result is a product of genuine skill or merely of good luck? Genuine skill is likely to persist, while luck is random and soon dissipates. Therefore one key measure of active management skill is the consistency of a fund’s outperformance.

The Persistence Scorecard attempts to distinguish luck from skill by measuring the consistency of active managers’ success. This report shows that, regardless of asset class or style focus, few fund managers have consistently outperformed their peers.

For example, only 3.84% of domestic equity funds in the top half of the distribution in 2015 maintained that status annually through 2019, significantly below what random chance would predict. Similarly, just 0.18% of the 2015’s top-quartile domestic equity funds maintained that performance over the next four years, again below random chance.

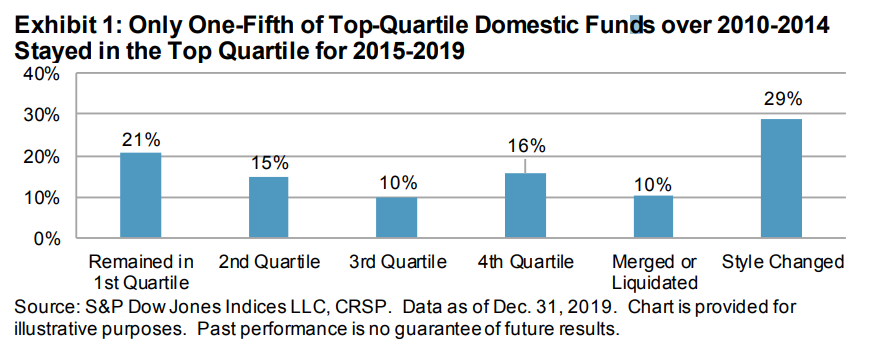
Lengthening the horizon to consider performance over two consecutive five-year periods, Exhibit 1 shows that the top-quartile domestic equity funds of 2010-2014 had little luck maintaining their top-quartile status for the 2015-2019 period.  In fact, the most likely outcome for a top-quartile fund was liquidation or style change (39% together).

U.S. Persistence Scorecard Year-End 2019 - Exhibit 1

Compared with our previous reports, persistence appeared to improve over shorter investment horizons. Of the top-quartile domestic equity funds in 2017, 37.17% managed to stay in the top quartile annually through 2019.  However, this persistence was inconsistent and decayed over time. For example, 61.34% of 2017’s top-quartile domestic equity funds were ranked in the top quartile for 2018.  Rewinding the clock two years, just 3.38% of 2015’s top-quartile funds maintained that status in 2016.

There were few patterns to be found among equity funds’ performance, as the random distribution of fund performance over various time frames covered large-, mid-, small-, and multi-cap focused funds.  One notable observation came from small-cap funds in the three-year period, as just 1.67% of 2014-2016 top-quartile funds remained in the top quartile for 2017-2019.

Unsurprisingly, the one pattern that did hold across equity funds was the tendency of the poorest funds to close. Fourth-quartile funds were generally the most likely to merge or liquidate over the subsequent three- and five-year windows, with nearly 38% of the bottom-quartile multi-cap funds of 2010-2014 disappearing by 2019.

Perhaps more surprisingly, style changes did not appear to be correlated with fund performance.  Top, middle, and bottom performers within a category all generally had similar chances of style drift over three- or five-year periods.  Multi-cap funds had the highest percentage of style change, with 31% making a change over three years and 40% over five years.

Fixed income funds showed similar results to equities, with rare pockets of one-year persistence and little evidence for consistent annual outperformance over longer periods. In 10 of the 13 categories considered, no top-quartile funds from 2015 maintained that status annually through 2019.

Transition matrices showed slightly more evidence of fixed income fund persistence.  Over the three-year horizon, the most likely outcome for top-quartile funds in 11 of the 13 categories was to remain in the top quartile.  In 10 of the 13 categories, this outcome occurred for 50% or more of top-quartile funds.  Similar results existed over the five-year window.  However, in many fixed income fund categories, fewer than 20 funds qualified within each quartile, perhaps leading to small sample size effects.

pdf-icon PD F Download Full Article

Australia Persistence Scorecard: Year-End 2019

Contributor Image
Priscilla Luk

Managing Director, Global Research & Design, APAC

EXECUTIVE SUMMARY

  • While comparing active funds against respective benchmark indices is a typical practice to evaluate their performance, persistence is an additional test that can reveal fund managers’ skills in different market environments.
  • In this report, we measure the performance persistence of active funds that outperformed their peers and benchmarks over consecutive three- and five-year periods, and we analyze their transition matrices over subsequent periods.
  • Overall results showed only a minority of high-performing Australian funds persisted in outperforming their respective benchmarks or consistently stayed in their respective top quartiles for three or five consecutive years.

  • Among top-quartile funds, 14.1% and 1.0% consistently maintained top-quartile rankings over consecutive three- and five-year periods, respectively. Top-quartile funds in the Australian Bonds category had the highest performance persistence among all categories.
  • The transition matrix, which tracks the trajectory of funds in each quartile, also showed that top-quartile funds in the Australian Bonds category had the highest persistence, with more than 75% of funds showing performance persistence over two non-overlapping three- and five-year periods.
  • Over three and five consecutive years, 15.8% and 1.3% of outperforming funds consistently beat their benchmarks, respectively. The Australian Equity Mid- and Small-Cap funds had the highest persistence over three consecutive years, but no fund category showed persistent outperformance over five consecutive years.
  • None of the fund categories exhibited strong performance persistence over the two successive five-year periods, but funds that outperformed in the first five-year period tended to have a lower liquidation rate in the subsequent five years across all categories.

pdf-icon PD F Download Full Article

SPIVA® Canada Scorecard Year-End 2019

SUMMARY

2019 was an excellent year across global equity markets, and Canadian equities were no exception.  Following a selloff in the fourth quarter of 2018, the S&P/TSX Composite rebounded 22.9% in 2019, posting positive returns in 10 of the 12 months.  Smaller-cap names in the S&P/TSX Completion gained 26.1%, outpacing the 21.9% return of the S&P/TSX 60.

The S&P/TSX Composite posted its highest annual return since 2009, capping a decade-long run that saw a total gain of 94.9%.  Amid this historic bull market, however, 92% of Canadian Equity funds underperformed their benchmark in 2019, and 86% underperformed over the decade.  This deficit was not an outlier, as a majority of funds underperformed across all categories for 2019.  Canadian Dividend & Income Equity managers fared the worst in 2019; only 2% of funds surpassed the S&P/TSX Canadian Dividend Aristocrats®.

SPIVA Canada Scorecard Year-End 2019 Exhibit 1


Latin America Persistence Scorecard May 2020

Contributor Image
María Sánchez

Director, ESG Index Product Strategy, Latin America

INTRODUCTION

  • A key dimension of any active versus passive debate is managers' ability to consistently deliver above-average returns over multiple periods. Persistence in performance is one way to differentiate skill from luck.
  • In this report, we measure the performance persistence of active funds in Brazil, Chile, and Mexico that outperformed their peers over consecutive three- and five-year periods. We also analyze how their performance ranking transitioned over subsequent periods.

SUMMARY OF RESULTS

Brazil

  • Exhibit 2 highlights the inability of top-performing equity fund managers to consistently replicate their success in subsequent years - regardless of size focus, by the fourth year, no fund remained in the top quartile.

  • Within fixed income, results in the government bond funds category were similar. However, the corporate bond funds category painted a slightly different picture; while the majority of managers were not able to maintain consistent outperformance for five years in a row, a noticeable 28% them were able to do so.
  • The five-year transition matrix highlights that top-quartile equity (30%), large-cap equity (38%), and government bond (70%) funds that remained active had a higher likelihood of remaining in the top quartile in the second five-year period.
  • Mid- and small-cap equity funds had a high frequency of closures - even for equity funds in the top quartile in the first five-year period, 30% were eventually merged or liquidated in the second five-year period. Thus, overall, a fund had a higher chance of shutting down than of remaining in the top quartile.
  • Top-quartile fund managers focused on corporate bond funds fared particularly poorly, as no manager remained in the top quartile in the second five-year

Chile

  • A minority of Chilean high-performing equity funds (10%) stayed in the top quartile for three consecutive years.
  • Exhibit 2 demonstrates the lack of persistence by equity managers in Chile - just 9% of top-performing funds in the first 12-month period repeated their outperformance in the second period. None of them persisted in the subsequent periods.
  • The five-year transition matrix shows top-quartile managers in the first period that remained live in the second period were more likely to stay in the first quartile or to move to quartile two. However, a significant percentage of funds eventually shut down in the second period, especially the ones in the second and third quartile (50% and 60% respectively).

Mexico

  • No funds in the Mexican equity category managed to stay in the top quartile for three consecutive years.
  • The five-year performance persistence test shows that top-quartile managers had difficulty replicating their outperformance in future years. After one year, just 20% of managers remained in the top quartile, and by year two, that percentage dropped to 10%.
  • Exhibit 5 shows that top-quartile managers in the first five-year period were resilient and survived in the second five-year period, regardless of the quartile they ended in.
  • As observed in the SPIVA® Latin America Year-End 2019 Scorecard, Mexico had a higher rate of survivorship than Brazil and Chile in the five-year period.

pdf-icon PD F Download Full Article

Risk-Adjusted SPIVA® Scorecard: Year-End 2019

Contributor Image
Berlinda Liu

Director, Multi-Asset Indices

Modern Portfolio Theory tells us that higher returns tend to be associated with higher risk. While our SPIVA Scorecards typically show that active funds underperform their benchmarks in absolute returns, they do not address the claim that active funds may be superior to passive investment after adjusting for risk.

As an extension of the standard SPIVA Scorecard, the Risk-Adjusted SPIVA Scorecard assesses the risk-adjusted returns of actively managed funds against their benchmarks on both a net-of-fees and gross-of-fees basis. We consider volatility, calculated through the standard deviation of monthly returns, as a proxy for risk, and we use return/volatility ratios to evaluate performance.

In the past decade in U.S. equity markets, the S&P 500® gained 257%, with positive total returns in 9 of 10 years and 86 of 120 months. However, these steady tailwinds did little to boost the case for active fund managers. After adjusting for risk, the majority of actively managed domestic funds in all categories underperformed their benchmarks on a net-of-fees basis over mid- and long-term investment horizons.

The risk-adjusted performance of active funds obviously improves on a gross-of-fees basis, but even then, outperformance is scarce. Only Real Estate (over the 5- and 15-year periods), Large-Cap Value (over the 15-year period), and Mid-Cap Growth funds (over the 5-year period) saw a majority of active managers outperform their benchmarks. Overall, most active domestic equity managers in most categories underperformed their benchmarks, even on a gross-of-fees basis.

As in the U.S., the majority of international equity funds across all categories generated lower risk-adjusted returns than their benchmarks when using net-of-fees returns. On a gross-of-fees basis, only International Small-Cap funds outperformed on a risk-adjusted basis over the 10- and 15-year periods.

When using net-of-fees risk-adjusted returns, the majority of actively managed fixed income funds in most categories underperformed over all three investment horizons. The exceptions were Government Long, Investment Grade Long, and Loan Participation funds (over the 5- and 10-year periods), as well as Investment Grade Short funds (over the 5-year period).

However, unlike their equity counterparts, most fixed income funds outperformed their respective benchmarks gross of fees. This highlights the critical role of fees in fixed income fund performance. In general, more active fixed income managers underperformed over the long term (15 years) than over the intermediate term (5 years).

On a net-of-fee basis, asset-weighted return/volatility ratios for active portfolios were higher than the corresponding equal-weighted ratios, indicating that larger firms have taken on better-compensated risk than smaller ones. On an equal-weighted measure, all domestic equity categories underperformed over all investment horizons, except for Real Estate Funds over the five-year horizon.

However, on an asset-weighted measure, over the five-year period, Real Estate, All Mid-Cap, All Small-Cap, Mid-Cap Growth, and Small-Cap Growth funds outperformed their benchmarks. Large-Cap Value funds was the only category that generated higher asset-weighted return/volatility ratios than the benchmark over the 15-year period.

Most fund categories produced higher return/volatility ratios than their benchmarks, gross of fees, on an equal-weighted basis. However, their outperformance diminished once fees or fund size were accounted for, especially in domestic and international equity funds. In general, equal-weighted return/volatility ratios improved more than the corresponding asset-weighted ratios when fees were ignored, indicating that fees play a more prominent role in smaller funds’ performance.

pdf-icon PD F Download Full Article

Processing ...