


S&P Dow Jones Indices has been the de facto scorekeeper of the ongoing active versus passive debate since the first publication of the S&P Indices Versus Active (SPIVA) U.S. Scorecard in 2002.
The SPIVA South Africa Scorecard measures the performance of actively managed South African equity, global equity and fixed income funds denominated in South African rand (ZAR) against their respective benchmark indices over various time horizons.
Year-End 2025 Highlights
South Africa Equity funds faced a relatively difficult year in 2025, posting majority underperformance rates compared with both the S&P South Africa 50 and S&P South Africa Composite Capped. Global Equity funds also experienced particularly challenging conditions, with 66% of managers failing to outperform the S&P World. Exhibit 1 presents a summary of results across all categories.
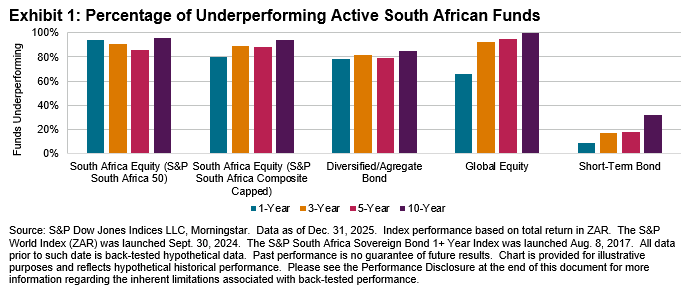
- South Africa Equity: The S&P South Africa 50 surged by an impressive 46% in 2025. Over the same period, South Africa Equity funds rose 35% on an asset-weighted basis and 34% on an equal-weighted basis. Despite these strong absolute returns, 80% of funds lagged the S&P South Africa Composite Capped. Underperformance became even more pronounced over longer horizons, with 89% of funds trailing the benchmark over 3 years, 88% over 5 years and 94% over 10 years. While short-term fund performance was robust, the results underscore a persistent challenge: most active funds struggled to outperform the benchmark over extended periods.
- Global Equity: The S&P World posted a gain of 7% in 2025, marginally outperforming the asset-weighted average return of Global Equity funds. In 2025, 66% of funds underperformed the index, a notable improvement from the 93% underperformance rate seen in 2024. However, underperformance became more pronounced over longer horizons, rising to 92% over 3 years and 100% over 10 years.
- Short-Term Bond: The STeFI Composite increased 8% in 2025, while Short-Term Bond fund managers delivered a stronger 10% gain on an asset-weighted basis. Short-Term Bond managers also achieved the strongest relative performance across categories for the year, with only 9% of funds underperforming the benchmark. This strength largely persisted over longer horizons. Underperformance rates remained relatively low at 17%, 18% and 32% over 3-, 5- and 10-year periods, respectively.
- Diversified/Aggregate Bond: The S&P South Africa Sovereign Bond 1+ Year Index rose 24% in 2025. Over the same period, Diversified/Aggregate Bond funds gained 16% on both an asset-weighted and equal-weighted basis, with 78% of funds underperforming the index. Over the long term, underperformance rates remained elevated at 82% and 79% for the 3- and 5-year periods, respectively, and grew to 85% over the 10-year period.
- Fund Survivorship: For the one-year period ending Dec. 31, 2025, merger and liquidation rates across all categories did not exceed 6%, with the South Africa Equity category recording the highest level of attrition. Over longer periods, South Africa Equity funds also experienced the most pronounced decline in survivorship, with merger and liquidation rates rising to 17%, 28% and 51% over the 3-, 5- and 10-year periods, respectively. Across all categories, 39% of funds did not survive over the 10-year period.
