


Inaugurated in 2002, the S&P Indices Versus Active (SPIVA) Scorecards have become a de facto scorekeeper of the ongoing active versus passive debate. The SPIVA South Africa Scorecard measures the performance of actively managed South African equity, global equity and fixed income funds denominated in South African rand (ZAR), including active outperformance rates, survivorship and performance dispersion over a range of time horizons.
Mid-Year 2025 Highlights
The first half of 2025 proved to be a highly challenging environment for actively managed South African domestic equity and diversified bond funds; even achieving top-quartile performance would not have been sufficient to guarantee benchmark-beating returns. However, actively managed short-term bond funds maintained their superior record, while there were mixed results for global equity managers. Underperformance rates generally increased with measurement horizons, with a cross-category average of 75% of active funds underperforming over the past 10 years (see Exhibit 1).
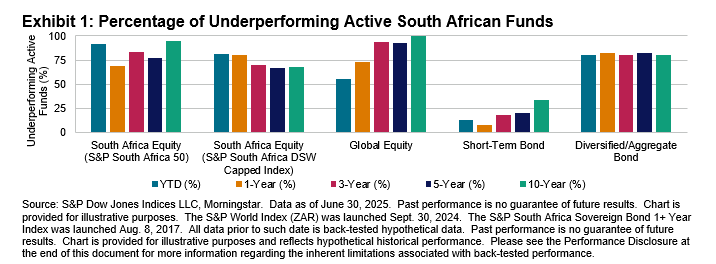
South Africa Equity Funds: The S&P South Africa 50 finished H1 2025 up 17.3%, while the broader S&P South Africa Domestic Shareholder Weighted (DSW) Capped Index rose 15.5%. Of all actively managed South Africa Equity funds, 92% and 81% underperformed those benchmarks, respectively, with funds in the category posting average gains of 11.0% and 12.4% on equal- and asset-weighted bases, respectively.
Over the first six months of the year, 2.0% of domestic active equity funds were liquidated or merged, slightly lower than the 10-year trailing compounded average of 2.5% of funds. Only 59.7% of funds survived over the 10 years ending in June 2025.
- Global Equity Funds: The S&P World Index (ZAR) had a total return of 3.8% during H1 2025, while Global Equity funds gained 3.9% and 4.9% on equal- and asset-weighted bases, respectively. Although the average return was higher than the benchmark’s, a slim majority equal to 55% of actively managed funds underperformed in H1. Underperformance rates rose sharply over longer time horizons in this category, rising to a full 100% of funds over a 10-year period.
- Short-Term Bond Funds: The SteFI Composite increased 3.8% in H1 2025, and just 13% of Short-Term Bond funds underperformed the index. Over the first half of 2025, bond funds in this category gained 3.9% and 4.1% on equal- and asset-weighted bases, respectively. Over the 3-, 5- and 10-year periods, 18%, 20% and 34% of funds underperformed, respectively. On a risk-adjusted basis, however, underperformance rates rose to 94%, 72% and 91% over the 3-, 5- and 10-year periods, respectively.
- Diversified/Aggregate Bond Funds: The S&P South Africa Sovereign Bond 1+ Year Index posted a gain of 6.6% in H1 2025, and 81% of Diversified/Aggregate Bond funds underperformed the index. The statistics were similar over longer horizons, although underperformance rates fell significantly on a risk-adjusted basis (see next section).
- Fund Survivorship: Liquidation rates for all categories were in low single digits for the six-month period ending June 30, 2025. The two bond fund categories had the highest attrition rate, both seeing 3.2%. Over the 10-year period, 40% of South Africa Equity funds merged or were liquidated, and 35% of funds disappeared across all categories (see Report 2).
