Since the first publication of the S&P Indices Versus Active (SPIVA) U.S. Scorecard in 2002, S&P Dow Jones Indices has been the de facto scorekeeper of the ongoing active versus passive debate. The SPIVA New Zealand Scorecard measures the performance of actively managed funds offered in New Zealand against benchmarks over various time horizons, covering both equity and bond funds.
2025 Highlights
2025 proved to be another challenging year for active funds in New Zealand, with a firm majority of funds underperforming relevant benchmarks across global and domestic equities, as well as domestic bonds. Notably, 79% of New Zealand Bond funds underperformed, marking a significant departure from their majority outperformance over the past four calendar years. Exhibit 1 summarizes the results across all reported categories over the 1- to 15-year periods ending December 2025.
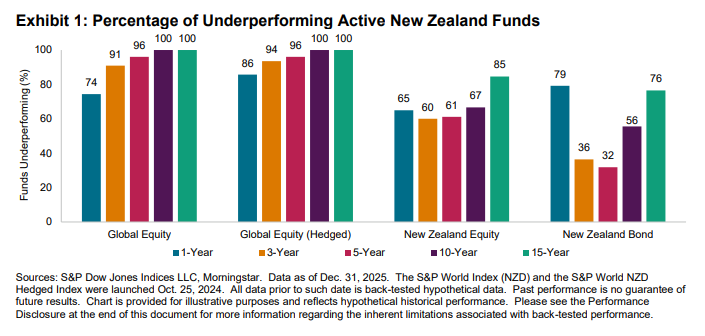
- Global Equity Funds: Despite relatively resilient results in the first half of 2025, active funds lost ground in the second half, recording a 74% full-year underperformance rate. The S&P World Index posted an 18.9% gain in New Zealand dollar terms (and a similar level of performance with currency hedging), compared to 1% in U.S. dollar terms. Actively managed Global Equity funds posted an average return of 15.4% on an asset-weighted basis. Global Equity (Hedged) funds returned 14.5%, with an 86% underperformance rate. Over the 10- and 15-year periods, all funds underperformed in both hedged and unhedged categories.
- New Zealand Equity Funds: The S&P/NZX 50 Index gained 3.3% (or 4.1% with imputation credits), while 65% of actively managed New Zealand Equity funds underperformed it. The funds in this category delivered an asset-weighted average return of 9%. Over the 15-year horizon, 85% of funds underperformed.
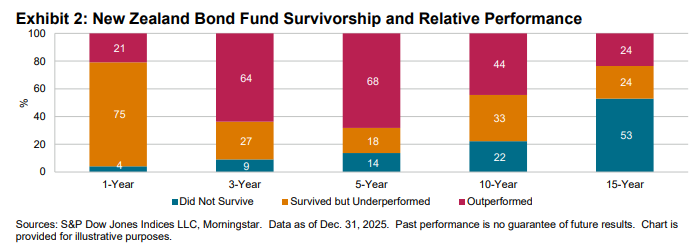
- New Zealand Bond Funds: After a strong track record of outperformance over the past four years, actively managed New Zealand Bond funds faced challenges in 2025, with 79% of funds underperforming. Larger funds fared relatively better, raising the category’s asset-weighted average return to 5.0%, compared to 8% on an equal-weighted basis, nearly matching the 5.1% gain of the S&P/NZX Composite Investment Grade Bond Index. Over the 15-year period, 76% of funds lagged the benchmark.
- Fund Survivorship: The number of active funds in New Zealand continued to grow, driven primarily by the launch of global equity funds. Fund liquidation remained minimal, with only 1 of 118 funds across all reported categories failing to survive. However, the attrition rate increased over longer time horizons; 16% and 47% of funds across all categories either merged or liquidated over the 10- and 15-year periods, respectively (see Report 5). Fund closures significantly affected the fund underperformance rate in the long term, as illustrated by the example of the New Zealand Bond category in Exhibit 2.