Since the first publication of the S&P Indices Versus Active (SPIVA) U.S. Scorecard in 2002, S&P Dow Jones Indices has been the de facto scorekeeper of the ongoing active versus passive debate. The SPIVA New Zealand Scorecard measures the performance of actively managed funds offered in New Zealand against benchmarks over various time horizons, covering both equity and bond funds.
Mid-Year 2025 Highlights
The fortunes of active managers in New Zealand changed notably in the first half of 2025. Active global equity managers improved their relative performance, with Global Equity funds recording one of their lowest underperformance rates in a while—equal to just 40%. Conversely, active domestic equity and bond managers faced challenges. In particular, 82% of New Zealand Bond funds underperformed, marking a significant departure from their majority outperformance over the past four calendar years. Exhibit 1 summarizes the results across all reported categories.
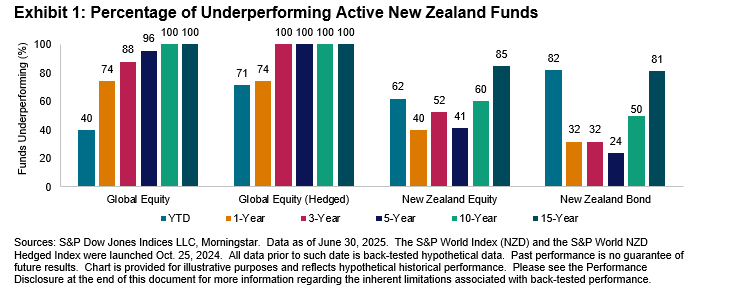
- Global Equity Funds: In the first half of 2025, global equities were characterized by the underperformance of U.S. equities and a sharp depreciation of the U.S. dollar. The S&P World Index posted a 1.6% return in New Zealand dollar terms, compared to 0% in U.S. dollar terms and 6.8% with currency hedging. Actively managed Global Equity funds posted an average return of 2.0% on an asset-weighted basis, with a 40% underperformance rate, significantly lower than in previous years. Global Equity (Hedged) funds saw a higher underperformance rate of 71%. Over 10- and 15-year time horizons, 100% of funds in both hedged and unhedged categories underperformed.
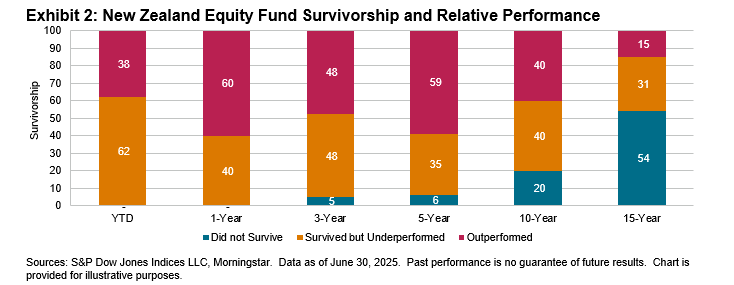
- New Zealand Equity Funds: The S&P/NZX 50 Index posted a 3.9% loss (-3.6% with imputation credit), while 62% of actively managed New Zealand Equity funds underperformed it. The funds in this category achieved an asset-weighted average return of -3.8%. Over the 15-year horizon, 85% of funds underperformed.
- New Zealand Bond Funds: After a strong track record of outperformance over the past four years, actively managed New Zealand Bond funds faced challenges in H1 2025, with 82% of funds underperforming. Larger funds fared relatively better, raising the category’s asset-weighted average return to 2.3%, compared to 2.1% on an equal-weighted basis—a return matched by the S&P/NZX Composite Investment Grade Bond Index. Over the 15-year period, 81% of funds lagged the benchmark.
- Fund Survivorship: Fund liquidation remained minimal in H1 2025, with only 1 out of 118 funds across all reported categories failing to survive. However, the attrition rate increased over longer time horizons; 50% of funds across all categories either merged or liquidated over the 15-year period. This trend significantly affected the fund underperformance rate, as illustrated by the example of the New Zealand Equity category in Exhibit 2.