












































Since the first publication of the S&P Indices Versus Active (SPIVA) U.S. Scorecard in 2002, S&P Dow Jones Indices has been the de facto scorekeeper of the ongoing active versus passive debate. The SPIVA Japan Scorecard measures the performance of actively managed funds offered in Japan against their assigned benchmarks over various time horizons, covering large-, mid- and small-cap segments, as well as international and global equity funds.
Mid-Year 2026 Highlights
The first half of 2026 produced mixed results for active equity funds in Japan. Japanese Large-Cap funds offered a notable exception to the rule, with more than 7 out of 10 outperforming their assigned benchmark, while Japanese Mid-/Small-Cap and overseas equity funds recorded near-opposite results. A majority of funds in every category underperformed over longer investment horizons. Exhibit 1 summarizes the results over periods ranging from 6 months to 15 years ending June 30, 2026.
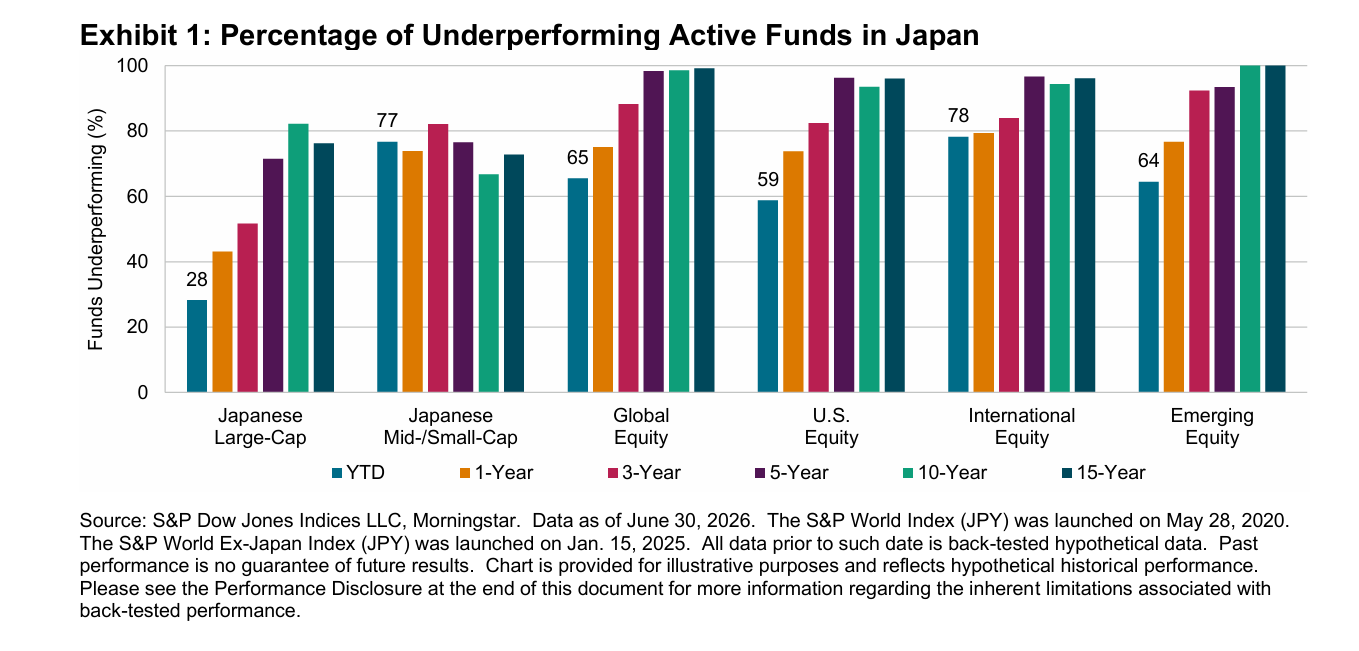
- Japanese Large-Cap Funds: The S&P/TOPIX 150 gained 17.8% in H1 2026, while actively managed Japanese Large-Cap funds returned 23.2% and 20.9% on equal- and asset-weighted bases, respectively. Only 28% of funds underperformed, the lowest rate among all categories. However, underperformance rates rose substantially over longer horizons, reaching 82% and 76% over the 10- and 15-year periods, respectively.
- Japanese Mid-/Small-Cap Funds: Japanese Mid-/Small-Cap funds struggled to keep pace with the strong benchmark performance. The S&P Japan MidSmallCap rose 24.4%, while 77% of funds underperformed in H1 2026. Underperformance rates declined over longer horizons but remained elevated, at 67% and 73% over the 10- and 15-year periods, respectively.
- Global Equity Funds: The S&P World Index gained 13.4% in JPY terms during H1 2026, while Global Equity funds returned 11.0% and 9.9% on equal- and asset-weighted bases, respectively. As a result, 65% of funds underperformed. Longer-term results were considerably weaker, with 98%-99% of funds lagging over the 5-, 10- and 15-year horizons.
- U.S. Equity Funds: The S&P 500® advanced 14.3% in JPY terms, while U.S. Equity funds returned 13.3% and 7.8% on equal- and asset-weighted bases, respectively. Despite a potentially supportive market backdrop, 59% of funds underperformed. Over the 10- and 15-year horizons, 93% and 96% of funds underperformed, respectively.
- International Equity Funds: International Equity funds recorded the highest underperformance rate among all categories, at 78% in H1 2026. These funds returned 10.1% and 13.6% on equal- and asset-weighted bases, respectively, compared with a 13.0% gain in the S&P World Ex-Japan Index in JPY terms. Underperformance remained high over longer horizons, reaching 94%-97% over the 5-, 10- and 15-year periods.
- Emerging Equity Funds: Emerging Equity funds recorded a 64% underperformance rate during H1 2026. Although the S&P Emerging Plus Index gained 26.9% in JPY terms, most active funds failed to keep pace. Longer-term results remained particularly challenging, with 100% of funds underperforming over both the 10- and 15-year horizons.
- Fund Survivorship: Fund attrition remained limited over shorter horizons, with 99% of funds surviving through H1 2026 across all categories. Survivorship declined steadily over time, with only 46% of funds surviving over 15 years. Overseas categories, particularly Emerging Equity funds, exhibited some of the lowest long-term survivorship rates (see Report 2).
