


Summary
Since the first publication of the S&P Indices Versus Active (SPIVA) U.S. Scorecard in 2002, S&P Dow Jones Indices has been the de facto scorekeeper of the ongoing active versus passive debate. The SPIVA India Scorecard measures the performance of Indian actively managed funds against their respective benchmarks over various time horizons, encompassing equity and bond funds while providing statistics on outperformance rates, survivorship rates and fund performance dispersion.
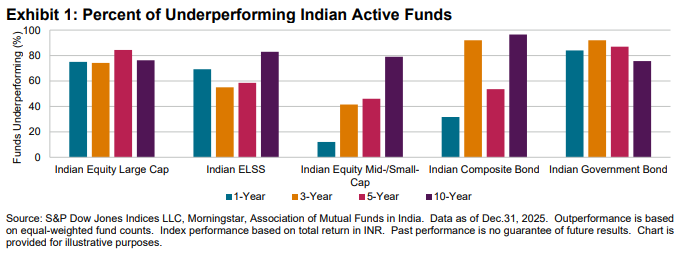
Year-End 2025 Highlights
Indian active managers experienced mixed fortunes in 2025. Many active large-cap and equity-linked saving schemes (ELSS) funds struggled to match the broad market performance, while active mid-/small-cap funds delivered a majority outperformance, marking their best relative results since 2014. Active composite bond funds also did well, while government bond funds had the highest rate of underperformance among all categories. Despite some short-term successes, a firm majority of funds in every category underperformed over the decade ending in December 2025.
Indian Equity Large-Cap Funds
- The S&P India LargeMidCap climbed 8.9% in 2025, while Indian Equity Large-Cap funds gained 7.3% and 9.4% on equal- and asset-weighted bases, respectively. The underperformance rate hit 75.0% over the 1-year period, compared to 74.2%, 84.4% and 76.3% over the 3-, 5- and 10-year horizons, respectively.
Indian ELSS Funds
- The S&P India BMI gained 6.3% in 2025, and 69.2% of Indian ELSS funds underperformed the index. Underperformance rates were 55.0%, 58.5% and 82.9% over the 3-, 5- and 10-year horizons, respectively.
Indian Equity Mid-/Small-Cap Funds
- The benchmark for Indian Equity Mid-/Small-Cap funds, the S&P India SmallCap, plunged 7.9% in 2025, while Indian Equity Mid-/Small-Cap funds dropped 0.7% and 0.3% on equal- and asset-weighted bases, respectively. The underperformance rate was just 12.1% over the 1-year period and reached 41.5%, 46.0% and 79.0% over the 3-, 5- and 10-year horizons, respectively.
Indian Government Bond Funds
- The iBoxx ALBI India increased 6.6% in 2025. One out of six active funds beat the benchmark, with an underperformance rate of 84.0%. Over the 3-, 5- and 10-year periods, 92.0%, 87.0% and 75.6% of funds underperformed, respectively.
Indian Composite Bond Funds
- In 2025, Indian Composite Bond funds had an underperformance rate of 31.7%, while 92.0%, 53.6% and 96.5% of funds underperformed over the 3-, 5- and 10-year periods, respectively.
Fund Survivorship
- Just one fund was liquidated across the five categories in the one-year period ending Dec. 31, 2025. Over the 10-year period, 44% of Indian Government Bond funds merged or were liquidated, and 27% of funds across all categories failed to survive (see Report 2).
