


Now in its 12th year of publication in Europe, the S&P Indices Versus Active (SPIVA) Scorecards seek to inform an ongoing debate on the relative merits of active and passive investing by analyzing active fund performance across the world’s major fund markets.
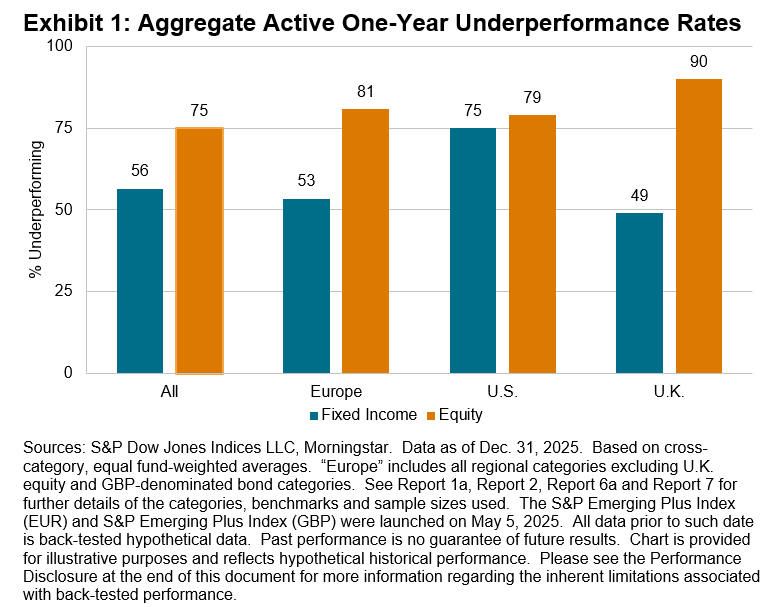
European-domiciled active equity fund managers were presented with material opportunities for outperformance in 2025 as tariff turmoil and AI innovation created both winners and losers. At the same time, relatively benign tailwinds for active fixed income strategies arose from the year’s trends in credit spreads and yield curve dynamics. Overall, fewer fixed income funds underperformed than equity funds, with the contrast proving more extreme in markets closer to home (see Exhibit 1).
2025 Highlights
- For a third consecutive year, there were gains in almost all our fund category benchmarks and in tandem, most active funds delivered positive returns in absolute terms. However, benchmark-beating returns continued to be harder to find.
- It was another challenging year for active equity funds domiciled in Europe, with majority underperformance found in 18 out of 21 reported categories and beat rates of less than 25% in more than one-half of reported categories. Active fixed income funds had lower underperformance rates on average, but more than one-half of funds still underperformed in 7 out of 10 reported categories.
- In the category with the largest number of available funds, namely Global Equity funds denominated in euros, 71% of actively managed funds underperformed the S&P World over the full year. The equivalent statistic for U.K. pound sterling-denominated Global Equity funds was 75%.
- Narrowing to the European continent, 82% and 78% of pan-regional active equity funds denominated in euros and sterling, respectively, underperformed the S&P Europe 350®. The record of euro-focused bond managers was middling, with 48%, 54% and 57% of funds underperforming in the Government Bond, Corporate Bond and High Yield Bond euro categories, respectively.
- The U.K. stock market proved particularly grueling for active funds; 89% of funds in the U.K. Large-/Mid-Cap Equity category underperformed and so did 97% of funds in the U.K. Small-Cap Equity category. In contrast, there was majority outperformance among GBP-denominated active Corporate Bond funds, and a relatively slim majority, 59%, of active U.K. Government Bond funds lagged the category benchmark.
