Since the first publication of the S&P Indices Versus Active (SPIVA) U.S. Scorecard in 2002, S&P Dow Jones Indices has been the de facto scorekeeper of the ongoing active versus passive debate.
The SPIVA Canada Scorecard measures the performance of Canadian actively managed funds against their respective benchmarks over various time horizons, covering large-, mid- and small-cap segments, as well as international and global equity funds.
Mid-Year 2025 Highlights
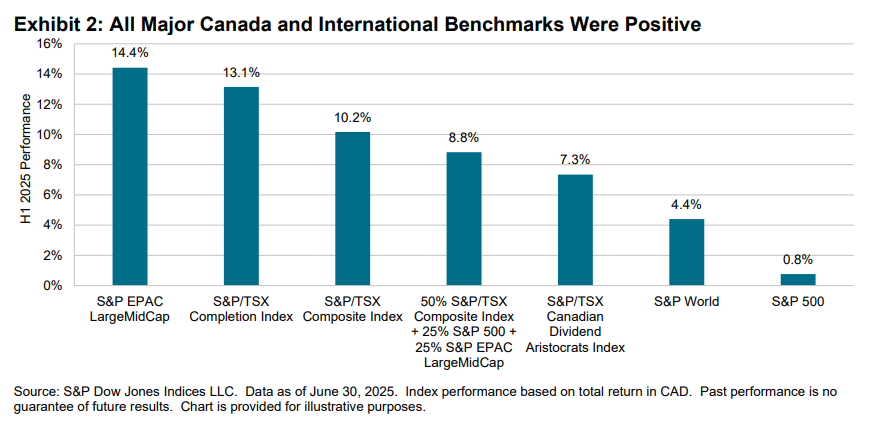
In the first half of 2025, few of Canada’s active funds could overcome global benchmark performances. Across categories, an average of over 71.2% of active funds underperformed their benchmarks, including Canadian Equity funds at 69.7%, Canadian Focused Equity funds at 94.8% and U.S. Equity funds at 71.4% (see Exhibit 1 and Report 1). Canadian Dividend & Income Equity funds posted the lowest full-year underperformance, with 44.2% lagging the benchmark. Underperformance rates generally increased with time.
- Canadian Equity Funds: The S&P/TSX Composite Index climbed 10.2% in H1 2025, while Canadian Equity funds gained 9.2% and 9.1% on equal- and asset-weighted bases, respectively. Underperformance rates hit 69.7% over the six-month period, climbing to 94.7%, 93.7%, 84.5% and 97.6% over the 1-, 3-, 5- and 10-year horizons, respectively.
- Canadian Focused Equity Funds: The blended benchmark of 50% S&P/TSX Composite Index + 25% S&P 500® + 25% S&P EPAC LargeMidCap increased 8.8% in H1 2025, outperforming 94.8% of Canadian Focused Equity funds. Underperformance rates were 98.4%, 93.8%, 78.3% and 99.1% over the 1-, 3-, 5- and 10-year horizons, respectively.
- Canadian Dividend & Income Equity Funds: The S&P/TSX Canadian Dividend Aristocrats® Index rose 7.3% during H1 2025, while Canadian Dividend & Income Equity funds gained 7.7% and 7.2% on equal- and asset-weighted bases, respectively. Underperformance rates hit 44.2% over the six-month period and reached 98.0%, 91.2%, 96.8% and 93.9% over the 1-, 3-, 5- and 10-year horizons, respectively.
- Canadian Small-/Mid-Cap Equity Funds: The S&P/TSX Completion Index increased 13.1% in H1 2025, and a full 100.0% of Canadian Small-/Mid-Cap Equity funds underperformed the index. Funds in this category gained 7.1% and 8.5% on equal- and asset-weighted bases, respectively, over the six-month period.
- S. Equity Funds: The S&P 500 increased 0.8% in H1 2025, and 71.4% of U.S. Equity funds underperformed the index. Few funds in the U.S. Equity category outperformed over the long term, with 85.5%, 84.0%, 98.6% and 96.4% underperforming over 1-, 3-, 5- and 10-year horizons, respectively.
- International Equity Funds:5% of International Equity funds trailed the S&P EPAC LargeMidCap in H1 2025, and 82.4%, 91.8%, 94.2% and 94.4% underperformed over the 1-, 3-, 5- and 10-year periods, respectively.
- Global Equity Funds: The S&P World Index increased 4.4% in H1 2025 and Global Equity funds gained 3.6% and 3.0% on equal- and asset-weighted bases, respectively. Over the six-month period, 66.1% of funds in the category trailed the benchmark. Over the 1-, 3-, 5- and 10-year periods, 87.5%, 95.9%, 96.0% and 98.3% of funds underperformed, respectively.
- Fund Survivorship: Liquidation rates for all categories were in the single digits for the six-month period ending June 30, 2025. Over the 10-year period, 45.9% of Canadian Equity funds merged or liquidated, and an average of 38.7% of funds disappeared across all categories (see Report 2).
Market Context
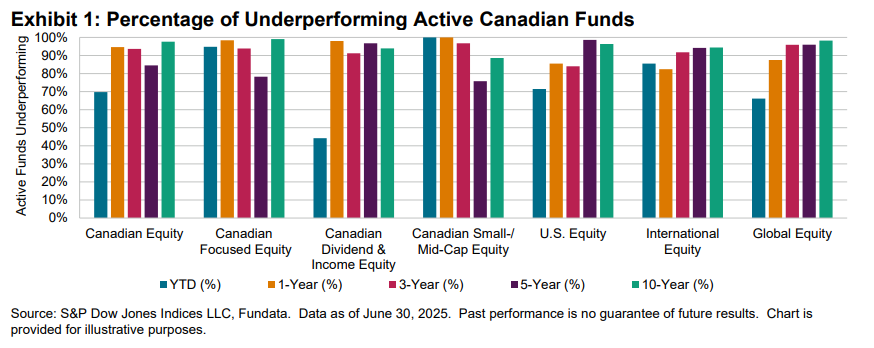
Following strong performance across global markets in 2024, all indices in the SPIVA Canada Scorecard maintained positive momentum through H1 2025. The S&P/TSX Composite Index was up 10.2% for the first half of the year, far surpassing the S&P 500, which rose only 0.8% in Canadian dollars. Smaller-cap Canadian companies and stocks outside of Canada fared even better, with the S&P/TSX Completion Index and the S&P EPAC LargeMidCap increasing 13.1% and 14.4%, respectively (see Exhibit 2).