


The SPIVA Australia Scorecard measures the performance of actively managed funds relative to benchmarks over various time horizons, encompassing equity, real estate and bond funds, while providing statistics on outperformance rates, survivorship rates and fund performance dispersion.
2025 Year-End Highlights
Australian active managers experienced mixed fortunes in 2025. Many active equity funds, both domestic and global, struggled to match the market performance. In contrast, active A-REIT funds delivered a majority outperformance, marking their best relative results since 2013. Active bond funds had the lowest rate of underperformance among all categories, extending their streak of majority outperformance to a third consecutive year. Despite these successes, a firm majority of funds in every category underperformed over the decade ending in December 2025.
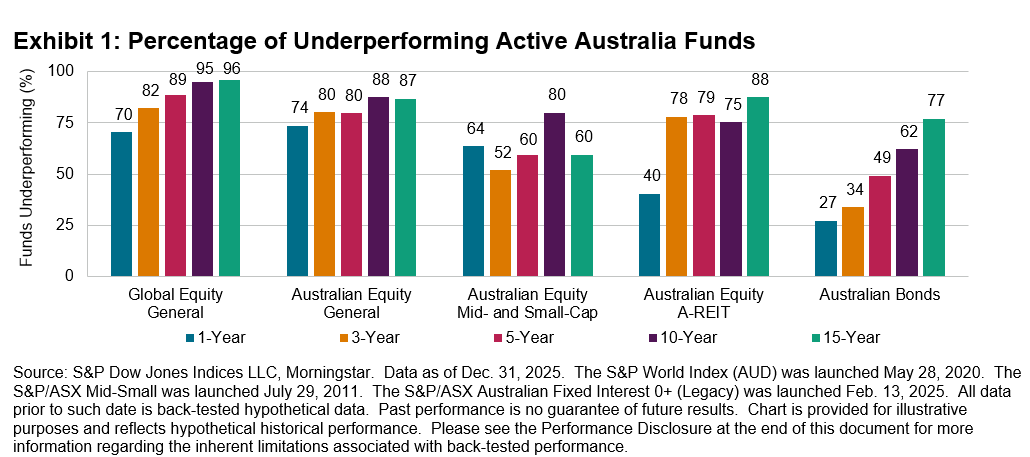
- Global Equity General Funds: Despite relatively resilient results in the first half of 2025, active funds lost ground in the second half and recorded a 70% full-year underperformance rate. These funds had an asset-weighted average return of 9.6%, versus the 13.3% gain in the S&P World Index (AUD). Underperformance rates increased for longer horizons, exceeding 95% over the 10- and 15-year periods.
- Australian Equity General Funds: The S&P/ASX 200 rose 10.3% in 2025, marking its third consecutive year of double-digit growth, while actively managed Australian Equity General funds returned 5% on an asset-weighted basis. The underperformance rate was 74%, compared with its long-term average of 60% (see Exhibit 7). Over 15 years, 87% of funds failed to beat the benchmark.
- Australian Equity Mid- and Small-Cap Funds: The S&P/ASX Mid-Small surged 21.5% in 2025, raising the hurdle for active funds. Nearly two-thirds (64%) of Australian Equity Mid- and Small-Cap funds underperformed, with an asset-weighted average return of 13.2%. Funds in this category exhibited comparatively stronger results over the long term, with 60% lagging the benchmark over the 15-year period.
- Australian Equity A-REIT Funds: While the S&P/ASX 200 A-REIT posted a healthy 9.2% gain, Australian Equity A-REIT funds delivered an asset-weighted average return of 11.7%, with 40% of funds underperforming—the lowest level since 2013. Over the 15-year period, however, 88% of funds underperformed.
- Australian Bonds Funds: Active bond funds’ relative performance improved in H2 2025 as credit spreads resumed tightening. The full-year underperformance rate was 27%, versus 46% in H1 2025, extending their low underperformance rates observed in 2024 (30%) and 2023 (26%). Funds returned 4.0% on an asset-weighted average basis, compared with 3.2% for the S&P/ASX iBoxx Australian Fixed Interest 0+ Index.
- Fund Survivorship: Liquidation rates remained moderate, averaging 4% across categories in 2025 (see Report 2). Australian Equity A-REIT funds again showed the highest liquidation rate at 7%, following 18% in Conversely, Australian Equity Mid- and Small-Cap funds recorded the highest survival rate of 97%. Attrition increased materially over longer time horizons, with 52% of funds across all categories merged or liquidated over the 15-year period.
