Summary
“I'm putting all my money in taxes. They're sure to go up.”
Bob Hope
Since 2002, S&P Dow Jones Indices (S&P DJI) has evaluated index versus active fund performance through the SPIVA Scorecards. In this report, we revisit the broad U.S. domestic equity categories with an additional layer of analysis, comparing the putative after-tax performance of indices and active funds.
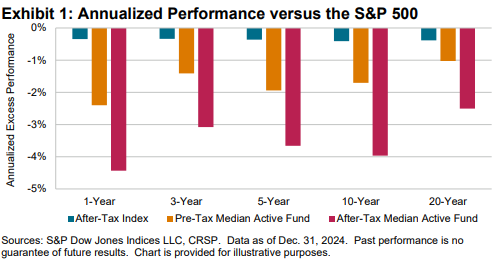
The average cumulative effects of taxes on investor returns are summarized in Exhibit 1 for the Large-Cap Core fund category. After tax, the median active fund trailed the S&P 500® over every time horizon, by up to 4.4% annually (see Exhibit 1).
Introduction
In this third-annual edition of the SPIVA After-Tax Scorecard, we again examine the impact of taxable mutual fund distributions on investor outcomes. Although every year brings its own unique challenges, markets in 2024 shared some similarities with 2023: the S&P 500 rose more than 20%, valuations and concentration were elevated relative to historical averages and active managers engaged in heavy trading, as evidenced by significant distributions of capital gains. As shown in the SPIVA U.S. Year-End 2024 Scorecard, such turnover did not, in the aggregate, equate to majority outperformance. A passive, capitalization-weighted index approach to equities continued to present a hurdle most managers could not overcome as large stocks with benchmark-beating performances continued to grow in size. Despite the tendency of many active managers to take profits by selling seemingly overpriced securities, more than 20 years of S&P DJI's SPIVA Scorecards illustrate that identifying the ideal time to sell in order to harness alpha is exceedingly difficult.
The challenges of effective market timing and stock selection are not the sole reasons to favor the patience inherent in indices such as the S&P 500. Further justification for an indexed strategy can be found in the potential tax implications tied to selling long-held profitable positions, as well as gains generated from short-term sales that are subject to an even higher tax rate. Consequently, it may be reasonable to argue that surpassing broad, capitalization-weighted indices becomes even more difficult when considering the tax consequences of active trading.
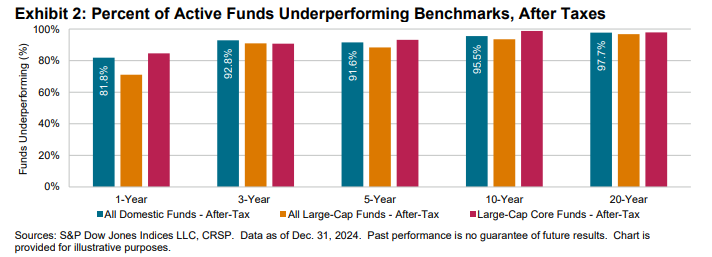
The existence of a common standard for reporting after-tax returns in U.S. mutual funds allows for measurement of tax impact on performance across selected categories from the traditional SPIVA Scorecards. Exhibit 2 highlights selected statistics from the detailed analyses that follow, confirming the relatively high long-term after-tax underperformance rates for actively managed U.S. domestic equity mutual funds.