


Summary
Can investment results be attributed to skill or luck? Genuine skill is more likely to persist, while luck is random and fleeting. Thus, one measure of skill is the consistency of a fund’s performance relative to its peers. The Persistence Scorecard measures that consistency and shows that, regardless of asset class or style focus, active management outperformance is typically relatively short-lived, with few funds consistently outranking their peers.
In five of the six reported equity fund categories and three of the four reported fixed income categories, not a single manager whose performance placed them in the top quartile for the 12-month period ending December 2018 managed to remain in the top quartile for the next four years (see Report 2 and Report 8).
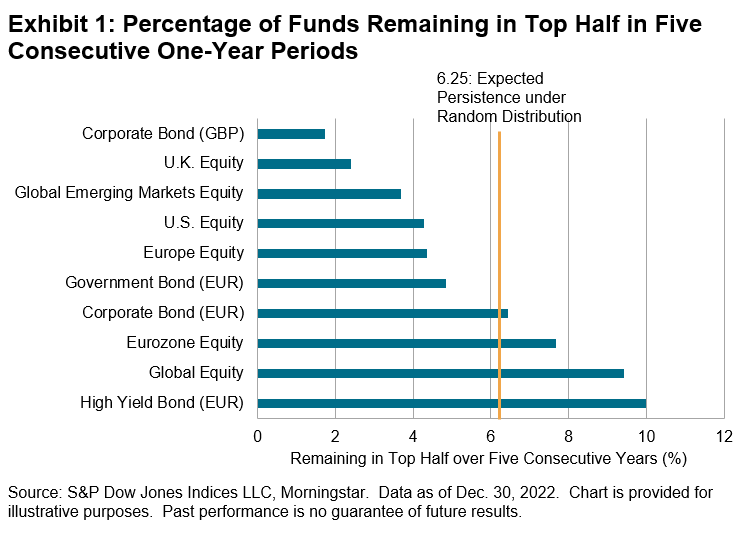
On the other hand, lowering the bar from the top quartile to the top half provides tentative evidence of persistence among a fraction of EUR-denominated fund categories. As Exhibit 1 illustrates, 10% of active funds in the High Yield Bond (EUR) category, 9% of active funds in the Global Equity category and 8% of active funds in the Eurozone Equity category were able to maintain their top-half status over five consecutive one-year periods.
