SUMMARY
Can investment results be attributed to skill or luck? Genuine skill is likely to persist, while luck is random and fleeting. Thus, one measure of skill is the consistency of a fund’s performance relative to its peers. The Persistence Scorecard measures that consistency and shows that, regardless of asset class or style focus, active management outperformance is typically short-lived, with few funds consistently outranking their peers.
Compared to previous years, active fund persistence somewhat improved in 2020. For example, 64.5% of domestic equity funds in the top half of the distribution for 2018 continued in the top half in 2019, and 55.0% repeated that feat in 2020. At first glance, this lends some credence to the idea of persistent outperformance (see Report 1).
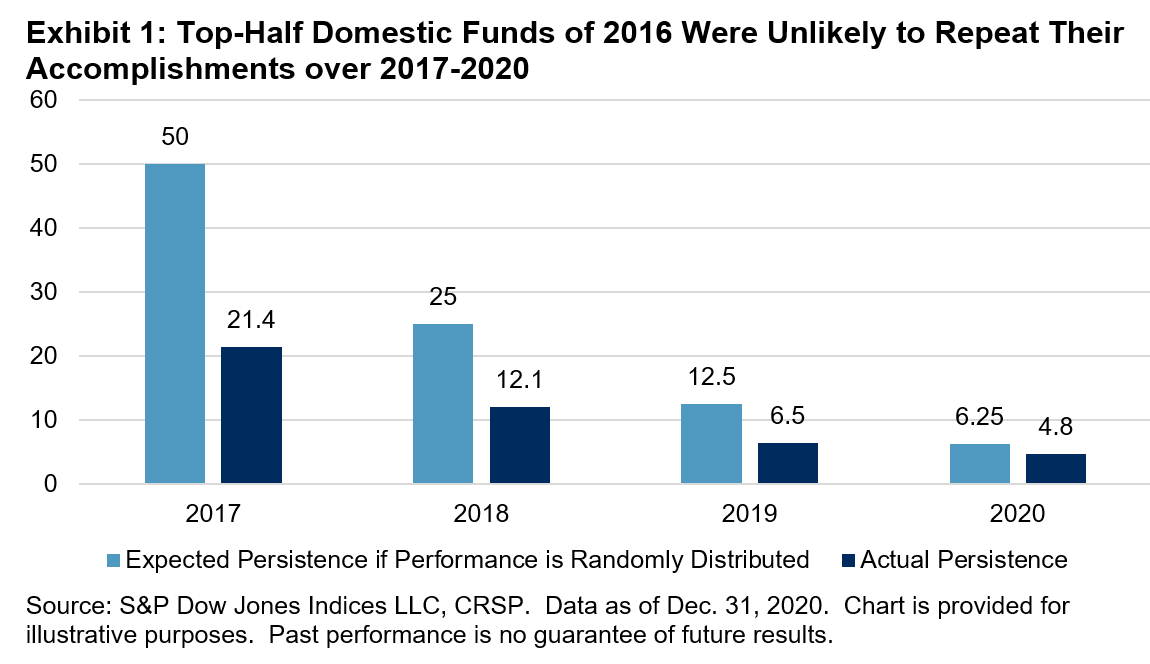
However, rewind the clock two years, and of the top-half funds of 2016, 21.4% repeated that accomplishment in 2017, with just 4.8% ranking in the top half each year through 2020. This rate is lower than what random chance would predict (see Exhibit 1 and Report 2).

Sign up to receive updates via email
Sign Up
This difference in persistence over three- and five-year windows was also visible in top-quartile funds. Of the top-quartile domestic equity funds in 2018, 33.7% managed to stay in the top quartile annually through 2020. In fact, in every equity category, more than 25% of 2018’s top-quartile funds stayed in the top quartile annually through 2020. Looking at 2016’s top-quartile funds paints a different picture: even in the best-performing category, mid-cap funds, only 1.5% of funds managed to stay in the top quartile annually through 2020 (see Reports 1 and 2).
Some statistically minded readers might note that these numbers are better than what would be expected if fund performance was randomly distributed. For example, the odds that a fund could remain in the top quartile for four consecutive years might be calculated as (25%)4 = 0.39%, and the 1.5% referenced above is substantially better than that. While the persistence report does not prove that fund performance is completely random, from a practical or decision-making perspective, it reinforces the notion that choosing between active funds on the basis of previous outperformance is a misguided strategy. After all, there remains a 98.5% chance that a top-quartile fund will not stay in the top quartile for the next four years.
Lengthening the horizon to consider performance over two consecutive five-year periods, the top-half domestic equity funds in the 2011-2015 period had little luck maintaining their top-half status for the 2016-2020 period. In fact, the chances of a top-half fund changing style or liquidating (39.8%) nearly matched the odds of remaining in the top half (41.0%) (see Report 6).
Unsurprisingly, the one pattern that did hold across equity funds was the tendency of the poorest funds to close. Fourth-quartile funds were the most likely to merge or liquidate over the subsequent three- and five-year windows, with 40.6% of the bottom-quartile mid-cap funds from the 2011-2015 period disappearing by 2020. In fact, closing their doors was the most likely outcome in four out of five equity categories for fourth-quartile funds in that period (see Report 5).


