Summary
Can investment results be attributed to skill or luck? Genuine skill is more likely to persist, while luck is random and fleeting. Thus, one measure of skill is the consistency of a fund’s performance relative to its peers. The Persistence Scorecard measures this consistency and reveals that, regardless of asset class or style focus, active management outperformance tends to be relatively short-lived.
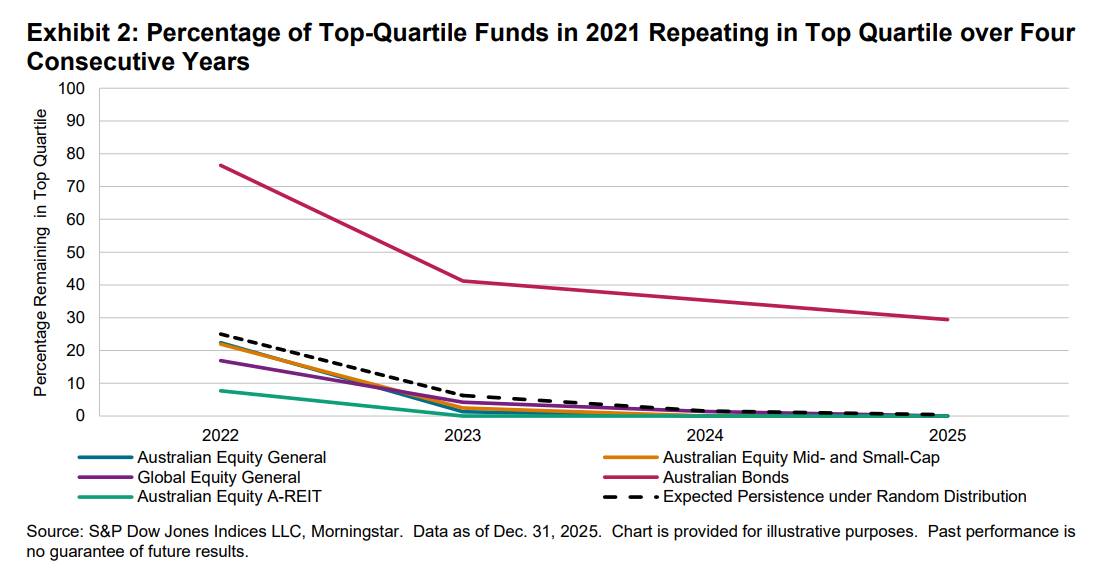
Among the top-quartile funds in all reported Australian fund categories over the five-year period ending in December 2020, only 22.4% maintained their top-quartile status in the subsequent five-year period, while 46.6% dropped to the bottom quartile or were merged or liquidated. Australian Bonds funds provided an exception, with more funds staying in the top quartile than falling to the bottom quartile or being merged or liquidated (see Exhibit 1 and Report 5).
Report Highlights
Among Australian active funds, persistent outperformance relative to peers was generally difficult to find in equity strategies. Conversely, fixed income funds showed some signs of skill, with a number of funds consistently outranking their peers over the past five years.
- Among Australia’s top-performing equity funds, most failed to maintain their outperformance in subsequent years. Of the 75 Global Equity General funds ranked in the top quartile in 2023, only 12 (16.0%) remained in the top quartile in 2024 and 2025. The results were worse for Australian Equity General funds, with only 5 (7.1%) of the 70 top-quartile funds sustaining their status for the following two consecutive years (see Report 1).
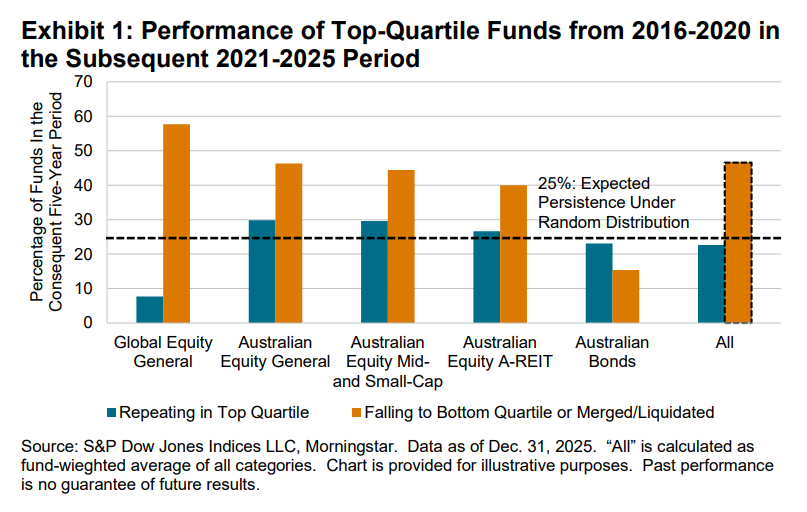
- Persistence in outperformance was rarer over longer time horizons. Among the funds that were ranked in the top quartile in 2021, none of the equity funds managed to remain in the top quartile for all four subsequent years (see Report 2 and Exhibit 2).
- In contrast, Australian Bonds funds showed notably better persistence. Of the 17 top-quartile funds in 2023, 7 (41.2%) remained in the top quartile each of the next two years (see Report 1). Of the 17 top-quartile funds in 2021, 5 (4%) retained their top-quartile status, significantly surpassing the odds of a random distribution (see Report 2 and Exhibit 2).