IN THIS LIST

Why the S&P 500 Matters to China

Political Risk and Emerging Market Equities: Applications in an Index Framework

Hidden in Plain Sight: U.S. Equities Beyond the S&P 500®

Commodities Index Innovation: The Next 30 Years

Simplicity Is Also Beautiful in Brazil: The S&P/B3 Low Volatility High Dividend Index

Why the S&P 500 Matters to China

Contributor Image
Jason Ye

Director, Factors and Thematics Indices

S&P Dow Jones Indices

Contributor Image
Hamish Preston

Head of U.S. Equities

S&P Dow Jones Indices

EXECUTIVE SUMMARY

Chinese investors tend to have high exposure to domestic equities and low exposure to international equities.  This home-country bias is common among investors globally.  U.S. equities represented 45% of the global equity market, as of Dec. 31, 2020.  Underallocation to international equities, including U.S. equities, means Chinese investors may be foregoing potential diversification benefits.

In this paper, we:

  • Discuss the global investment opportunities for Chinese investors and the potential results of investing globally;
  • Introduce the S&P 500 and explain how it is constructed;
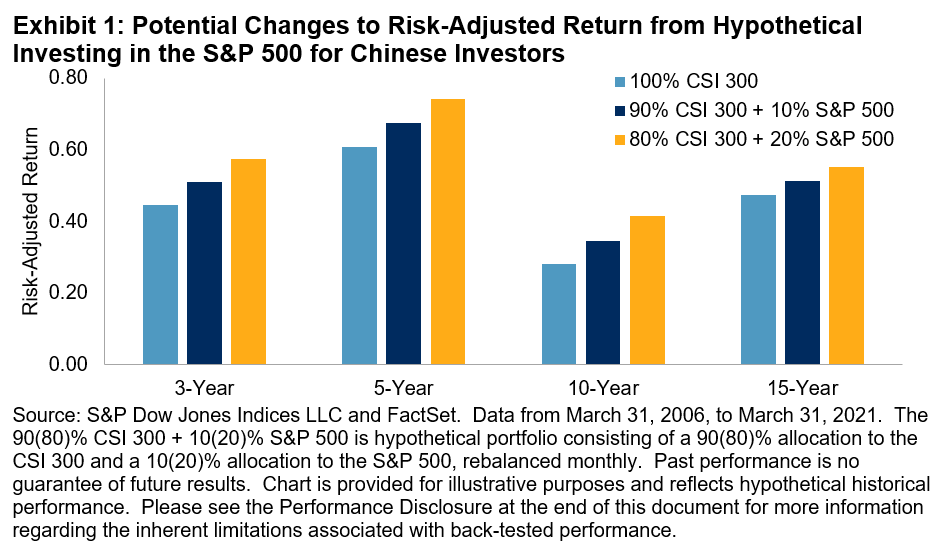
  • Highlight how the S&P 500 could affect Chinese investors’ ability to diversify domestic sector biases, gain exposure to U.S. economic growth, and improve historical risk-adjusted returns; and
  • List different channels where Chinese investors may access global markets and review the Qualified Domestic Institutional Investor (QDII) program.

Why the S&P 500 Matters to China: Exhibit 1

pdf-icon PD F Download Full Article

Political Risk and Emerging Market Equities: Applications in an Index Framework

Contributor Image
Hector Huitzil Granados

Analyst, Global Equity Indices

S&P Dow Jones Indices

INTRODUCTION

Political risk is widely presumed to affect emerging market equities. However, its impact has historically been difficult to assess due to the lack of quantifiable, systematic, and standardized political risk metrics.

The growing popularity of alternative data derived from natural language processing and sentiment analysis of global news media has opened new opportunities in the political risk space, including novel methods of devising systematic investment and asset allocation frameworks that are uniquely informed by a new generation of political risk indicators.

To take advantage of this development, S&P Dow Jones Indices has collaborated with GeoQuant, an AI-driven political risk data firm, to devise a best-in-class Emerging Markets Political Risk-Tilted Concept Index (hereafter the “Political Risk-Tilted Concept Index” or "Concept Index").

The Concept Index takes the S&P Emerging BMI as its starting point and rebalances country allocations monthly based on GeoQuant's custom "Macro-Government Political Risk Indicator," yielding the Political Risk-Tilted Concept Index by overweighting (underweighting) countries with relatively low (high) political risk.

We find that systematically incorporating political risk as a factor into emerging market equity allocation decisions can potentially drive outperformance relative to the benchmark S&P Emerging BMI. Outperformance is largely attributable to reduced overall volatility and greater insulation from downside risk.

Over a 2013-2020 back-test period, the Concept Index outperformed the S&P Emerging BMI using a standard set of back-test parameters. Specifically, the Concept Index yielded higher return/risk ratios over three-and five-year horizons, and on a cumulative basis over the full back-tested period, with an annualized excess return of 1.31% relative to its benchmark. It also demonstrated a consistently lower level of volatility, a relatively low annualized tracking error of 2.03%, and a lower monthly average turnover than its benchmark. On a monthly basis, the back-tested Concept Index outperformed the S&P Emerging BMI in the majority of all months, and in a larger majority of down months in which benchmark returns decreased. The back-test also outperformed the S&P Emerging BMI over 2020 despite well-known challenges in forecasting equity market performance during the COVID-19 pandemic.

The Political Risk-Tilted Concept Index is the first of its kind (to the best of our knowledge) and offers novel opportunities to leverage S&P Dow Jones Indices and GeoQuant data to inform emerging market equity allocation decisions.

MEASURING POLITICAL RISK: AN OVERVIEW

GeoQuant is a venture-backed, AI-driven political risk data firm that fuses political science and machine learning to systematically measure and predict political risks in real-time.

Well before COVID-19, the interplay of macro-economic policymaking and government (in)stability, and the lack of high-frequency data to measure these factors, made it notoriously difficult to assess the impact of political risk on equity prices, particularly in emerging markets. Technical advances in monitoring and predicting political risk were necessary.

To that end, GeoQuant has developed a best-in-class set of more than 20 political risk indicators for modeling and understanding the impact of political risk on markets. These indicators enable data-driven and systematic asset allocation in response to measurable, real-time variation in political risk.

Exhibit 1 provides a snapshot of GeoQuant’s core set of risk indicators, which collectively comprise GeoQuant’s "Fundamental Risk Model." The indicators measure the full spectrum of risks that are likely to affect commerce, trading, investment decisions, and intergovernmental relations. All indicators are generated by real-time natural language processing of traditional news media using proprietary algorithms for text-based sentiment analysis, as well as synchronous inputs and review by a team of PhD political economists.

pdf-icon PD F Download Full Article

Hidden in Plain Sight: U.S. Equities Beyond the S&P 500®

Contributor Image
Tim Edwards

Managing Director and Global Head of Index Investment Strategy

S&P Dow Jones Indices

Contributor Image
Sherifa Issifu

Senior Analyst, U.S. Equity Indices

S&P Dow Jones Indices

EXECUTIVE SUMMARY

• Mid- and small-cap U.S. equities represent a significant piece of the global market, but they are overlooked by many international investors, particularly those in Europe.

• The S&P MidCap 400® and S&P SmallCap 600® are simple, transparent benchmarks for U.S. mid and small caps. Over the past 20 years, they have outperformed the S&P 500, as well as a majority of actively managed U.S. equity funds in their respective size segment.

• Exhibit 1 summarizes the potential opportunity set for diversification by European fund investors, comparing the global equity market weight of U.S. small and mid caps to their estimated aggregate allocations within European-based equity funds.

Hidden in Plain Sight: U.S. Equities Beyond the S&P 500: Exhibit 1

INTRODUCTION

The U.S. stock market includes many of the world's largest and best-known companies, and investors the world over have allocated capital to U.S. equities. However, many investors appear to have explored little beyond the so-called "blue chips." As shown in Exhibit 1, European fund investors, in particular, have relatively minimal exposure to small- or mid-sized U.S. equities.

This lack of interest is puzzling, not least because U.S. mid and small caps represent significant market segments in absolute terms. At the end of 2020, the S&P MidCap 400 alone had a market capitalization similar to the entire French stock market, while the U.K.'s stock market, the largest in Europe, was roughly the same size as the mid- and small-cap indices combined.

Adding to the puzzle, historical performance is unlikely to have been a deterrent to European investors; the S&P MidCap 400 and S&P SmallCap 600 significantly outperformed the S&P 500, S&P United Kingdom BMI, and S&P Europe 350® over the past 26 years. Exhibit 2 illustrates their performance graphically (British pound, euro, and U.S. dollar performances are reported in Exhibit 10).

Hidden in Plain Sight: U.S. Equities Beyond the S&P 500: Exhibit 2

pdf-icon PD F Download Full Article

Commodities Index Innovation: The Next 30 Years

Contributor Image
Jim Wiederhold

Director, Commodities and Real Assets

S&P Dow Jones Indices

Contributor Image
Fiona Boal

Managing Director, Global Head of Equities

S&P Dow Jones Indices

Simplicity Is Also Beautiful in Brazil: The S&P/B3 Low Volatility High Dividend Index

Contributor Image
María Sánchez

Director, Sustainability Index Product Management, U.S. Equity Indices

S&P Dow Jones Indices

EXECUTIVE SUMMARY

For investors who seek higher dividend yield and lower volatility for better risk-adjusted returns, S&P Dow Jones Indices has proposed a two-step constituent screening method. In this paper, we discuss how this analysis can be applied to Brazilian equity markets using the S&P/B3 Low Volatility High Dividend Index.

  • The low volatility screen acts as a quality measure to avoid high-yield stocks with sharp price drops and seeks to capture the low volatility factor for the S&P/B3 Low Volatility High Dividend Index.
  • The S&P/B3 Low Volatility High Dividend Index delivered a higher absolute and risk-adjusted return than the benchmark, the S&P Brazil BMI, from May 31, 2007, to March 31, 2020 (see Exhibit 1).
  • The index outperformed the S&P Brazil BMI 83% of the time in down markets and underperformed 68% of the time in up markets. However, the outperformance in down markets was more pronounced than the underperformance in up markets.
  • Compared with its benchmark, the S&P/B3 Low Volatility High Dividend Index historically delivered higher dividend yield.

Simplicity Is Also Beautiful in Brazil: Exhibit 1

1. INTRODUCTION

Almost one year after launching the S&P/B3 Low Volatility High Dividend Index, we examine the potential advantage of incorporating a low volatility screen into a high-dividend-yield portfolio. We also compare the S&P/B3 Low Volatility High Dividend Index to other S&P Dividend Indices in the Brazilian equity market across various aspects such as sector composition, dividend yield, and historical return, among others.

Historically, the percentage of dividend payers in Brazil has ranged between 71% and 92%, making it a favorable environment for implementing dividend-focused strategies. In Brazil, S&P Dow Jones Indices has three different dividend-focused strategies, using different constructions and targeting different objectives:

The highest-yielding stocks in high-yield strategies often come with greater portfolio volatility, and Brazil is no exception. Therefore, an income strategy may require some form of volatility management for portfolio construction.

pdf-icon PD F Download Full Article

Processing ...