IN THIS LIST

Style Bias and Active Performance

Exploring Techniques in Multi-Factor Index Construction

The S&P Catholic Values Indices: A Multi-Asset Solution for Faith-Based Investing

Effective Scoring to Capture Quality and Value in China

From Zero to Hero: The Indian Case for Global Equity Diversification

Style Bias and Active Performance

Contributor Image
Craig Lazzara

Managing Director, Index Investment Strategy

S&P Dow Jones Indices

Contributor Image
Anu R. Ganti

Senior Director, Index Investment Strategy

S&P Dow Jones Indices

EXECUTIVE SUMMARY

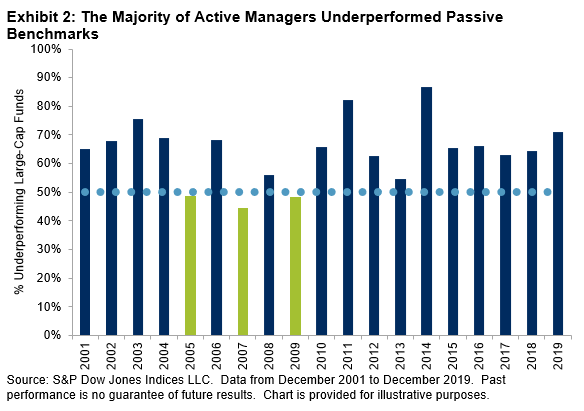
  • Style bias plays a major role in explaining active manager outperformance across the capitalization spectrum.
  • Active managers of large-capitalization portfolios tend to tilt down the cap scale, while mid- and small-cap managers tend to tilt up. Consequently, large-cap managers are most challenged when large-cap stocks beat mid- and small-caps.  Mid- and small-cap managers have the opposite tendency.
  • As Exhibit 1 illustrates, the likelihood that a majority of managers in a given capitalization tranche will outperform is importantly dependent on style favorability.
  • Similar results apply for fixed income managers.

Style Bias and Active Performance - Exhibit 1

A SIMPLE QUESTION

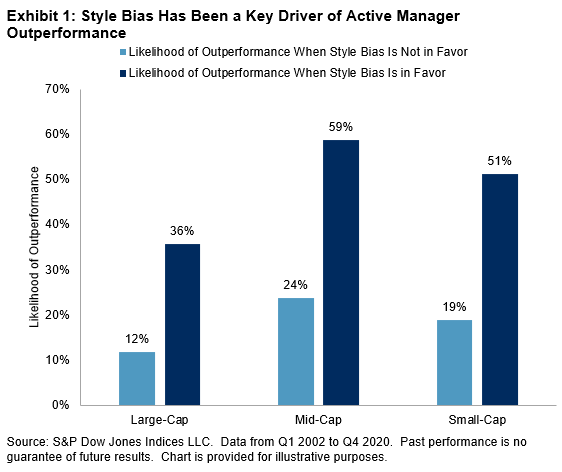
The evidence that most active portfolio managers typically underperform passive benchmarks appropriate to their investment style is extensive—both historically and geographically. Exhibit 2, for example, summarizes data from our firm’s SPIVA® Scorecards, which have documented the performance of U.S. managers since 2001 (with shorter histories for other markets). Of the 19 full calendar years for which we have U.S. SPIVA results, the majority of large-cap active managers outperformed the S&P 500® in only three.

This paper asks a simple question: what (if anything) distinguishes the three years when most active managers outperformed from the 16 years when the majority failed?

Style Bias and Active Performance: Exhibit 2

pdf-icon PD F Download Full Article

Exploring Techniques in Multi-Factor Index Construction

Contributor Image
Andrew Innes

Head of EMEA, Global Research & Design

S&P Dow Jones Indices

Contributor Image
Akash Jain

Director, Global Research & Design

S&P Dow Jones Indices

Contributor Image
Lalit Ponnala

Director, Global Research & Design

S&P Dow Jones Indices

In multi-factor equity index construction, the decision-making and practical implementation can be complex and challenging. This paper examines the range of portfolio construction choices available to those seeking rank-based, multi-factor approaches, and the relative advantages of each.

Through back-testing hypothetical portfolios based on the S&P 500®, this paper evaluates the following construction choices: top-down versus bottom-up; sector-neutral versus sector-agnostic; portfolio concentration; weighting scheme; and rebalancing frequency. To measure the effectiveness of each portfolio, a factor efficiency ratio (FER) is proposed, which allows investors to gauge their factor purity without having to invoke the complexity of a risk model.

Our paper concludes with key findings, including the following.

  • Sector-neutral portfolios may be more efficient than sector-agnostic.
  • Top-down approaches may dilute exposures but are still efficient.
  • Factor score-based weighting schemes may improve efficiency.

Exploring Techniques in Multi-Factor Index Construction: Exhibit 1

INTRODUCTION

The benefits of diversifying across a multitude of smart beta equity factors have been supported and explained in a host of research and literature. Single-factor indices (quality, value, momentum, low volatility, and small size) may reward market participants over the long term, but can be notoriously difficult to time over the shorter term. Multi-factor indices, on the other hand, generally forgo the need to time each factor and instead, through deliberate diversification, may provide more stable excess return outcomes.

Multi-factor equity investing may be well justified in theory; however, there are numerous practical portfolio construction choices to consider, each with its own advantages and implications. Without a consensus on the most effective multi-factor technique, indices offered in the market have fractured into a variety of vastly different methodologies. Some employ optimization and risk models to determine the most effective portfolio based on the strategy’s objectives. Others dismiss the complexity and lack of transparency of optimized solutions, instead favoring the relative simplicity of rank-based selection rules. Yet even within this latter realm, the choices may appear countless and overwhelming.

In this paper, we attempt to demystify the range of choices available to market participants seeking rank-based, multi-factor approaches. In doing so, we compare the relative advantages of each approach and discover the trade-offs between each decision. Critically, the approaches should be measured both on their effectiveness and efficiency in terms of risk.

Importantly, we do not advise investors which strategic factor allocation decisions are the more successful. Also, testing the robustness of multifactor performance across markets and time periods was outside the scope of this paper.

Instead, by testing only one multi-factor combination on the S&P 500, the paper’s purpose is only to demonstrate relationships among portfolio construction choices. Our goal is to arm market participants with the necessary knowledge to help determine which multi-factor portfolio construction techniques are most appropriate for their own investment objectives.

pdf-icon PD F Download Full Article

The S&P Catholic Values Indices: A Multi-Asset Solution for Faith-Based Investing

EXECUTIVE SUMMARY

  • Faith-based investing has been practiced in the U.S. for more than 150 years by believers from diverse religions.
  • The S&P 500® Catholic Values Index and the S&P U.S. Catholic Values Aggregate Bond Index exclude activities by certain companies or governments that are not aligned with the Socially Responsible Investment Guidelines of the U.S. Conference of Catholic Bishops (USCCB).
  • The S&P Catholic Values Indices Methodology, combined with the USCCB Guidelines, captures broad market performance with the added benefit of faith-based investing within a multi-asset-class index offering.

MEASURING THE MARKET THROUGH A CATHOLIC LENS

Sustainable investing has in one form or another been present throughout time. The notion of responsible investing is practically as old as investing itself. Records date back to the 18th century, when faith-based groups such as the Quakers and the Methodists provided guidance on “sinful” investments to avoid. To this day, faith-based strategies like Shariah-compliant investing are offered within the broader sustainable investment framework. Faith-based or faith-consistent investing begins with alignment with the formal religious teachings and beliefs of a tradition, and it includes promoting all the values, priorities, and practices judged to be consistent with those teachings.

Examples of aligning financial outcomes with one’s values range from faith-based investing, socially responsible investing, sustainable investing, or environmental, social, and governance (ESG) investing. The belief used to guide faith-based investing can be grounded in formal religious dogma or simply generational thinking, with an emphasis on seeking to leave the world a better place for the future.

pdf-icon PD F Download Full Article

Effective Scoring to Capture Quality and Value in China

Contributor Image
Priscilla Luk

Managing Director, Global Research & Design, APAC

S&P Dow Jones Indices

Contributor Image
Liyu Zeng

Director, Global Research & Design

S&P Dow Jones Indices

In the S&P China A Quality and Value Indices, various financial ratios are combined to form the respective factor scores. In this paper, we evaluate two methods used to normalize and combine the financial ratios—z-scores and SNDZ-scores1 —on how they resulted in different portfolio characteristics for quality and value in the China A market from 2006 through 2019.

EXECUTIVE SUMMARY
  • Equal-weighted quality and value subfactor z-scores resulted in unbalanced subfactor portfolio tilts and biased subfactor contribution to final scores.
  • When applying the equal-weighted z-scores approach, the quality portfolio was dominated by the accruals factor in its portfolio tilts and factor score contribution.
  • The quality portfolio based on the subfactor SNDZ-scores had more balanced and consistent tilts to various quality subfactors and a reduced number of stocks with low return-on-equity (ROE) and high leverage (LEV) ratios.
  • The SNDZ-score approach resulted in more all-around high-quality stocks that scored well across various quality measures.
  • Quality portfolios based on two different scoring methods had similar performances over the long-term history, with opposite performance cyclicality behavior.
  • The quality portfolio based on z-scores had procyclical performance characteristics while the one based on SNDZ-scores behaved defensively.
  • When using SNDZ-scores, the quality portfolio had higher sector bias in defensive sectors, including Health Care and Consumer Staples.
  • The quality portfolio based on SNDZ-scores had higher active exposures to profitability and low LEV. ROE attributed most to the active return and risk among all style factors.
  • Portfolio characteristic differences in value portfolios based on two different scoring methods are negligible.

pdf-icon PD F Download Full Article

From Zero to Hero: The Indian Case for Global Equity Diversification

Contributor Image
Tim Edwards

Managing Director and Global Head of Index Investment Strategy

S&P Dow Jones Indices

Until quite recently, Indian investors have had good reason to ignore global equities: from 2003 to 2018, India delivered the best returns out of any of the world’s 40 largest stock markets.1  Further deterring their interest, access to international markets has not always been easy or cheap. 

However, times are changing. During the COVID-19 pandemic, global markets found new champions in industries without close Indian equivalents, while Indian investors began showing interest in new, simpler routes to international diversification such as mutual funds and exchange-traded funds (ETFs).

By offering low-cost options to diversify, index-based investing has seen significant growth in other global markets, and 2020 brought India up to date with the first fund tracking the S&P 500®, which is perhaps the world’s most widely recognized equity benchmark. Soon, investors in India may be offered a range of options tracking indices for more global regions, global sectors, and even indices reflecting investment targets such as income, growth, or ethical investing.

Using the long histories of benchmarks and fund performance data published by S&P Dow Jones Indices (S&P DJI), this paper examines the arguments and opportunity set for index-based international diversification from an Indian perspective, with a focus on the practical impact of an allocation to global equities.

HOME BIAS IN INDIAN EQUITIES

We cannot know, down to the last Indian rupee or U.S. dollar, how much all Indian investors own in all international stocks. According to some academic estimates, the average allocation made to international equities by Indian investors is one of the lowest of any country, only a rounding error away from 0%2. Meanwhile, the distribution of AUM across the Indian mutual fund market supports the hypothesis that Indian investors have been almost exclusively domestically focused.

pdf-icon PD F Download Full Article

Processing ...