IN THIS LIST

S&P 500® Low Volatility Index: Five Decades of History

China's New Economy Sectors: How Are They Doing?

Blending Low Volatility with Dividend Yield in the China A-Share Market

Making STRIDEs in Evaluating the Performance of Retirement Solutions

A Look Inside Green Bonds: Combining Sustainability with Core Fixed Income

S&P 500® Low Volatility Index: Five Decades of History

Contributor Image
Phillip Brzenk

Managing Director, Global Head of Multi-Asset Indices

S&P Dow Jones Indices

Contributor Image
Hamish Preston

Head of U.S. Equities

S&P Dow Jones Indices

Contributor Image
Izzy Wang

Senior Analyst, Factors and Dividends

S&P Dow Jones Indices

S&P Dow Jones Indices (S&P DJI) publishes a series of low volatility indices, offering market participants a perspective on the returns of lower volatility equities and forming the basis for index-linked products globally.1 Low volatility indices have typically outperformed their underlying broad market benchmarks on both an absolute and a risk-adjusted basis.2 S&P DJI recently extended the returns history for one of the widely followed low volatility benchmarks—the S&P 500 Low Volatility Index—back to February 1972.3 Using the additional two decades of return information, this paper:

• Offers a longer-term perspective on the ability of low volatility indices to combine downside protection and upside participation;

• Assesses the relative importance of equity market movements and interest rates in explaining the low volatility index’s performance; and

• Demonstrates the potential applications of low volatility indices.

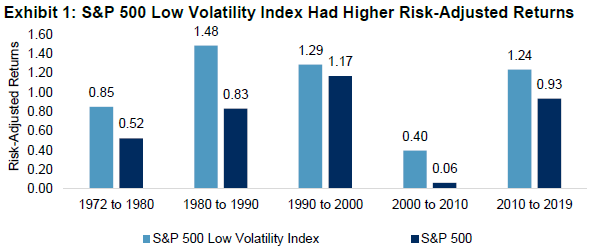
Exhibit 1 shows the risk-adjusted returns for the S&P 500 Low Volatility Index and the S&P 500 in each decade since 1972.

S&P 500 Low Volatility Index: Five Decades of History: Exhibit 1

Source: S&P Dow Jones Indices LLC. Chart based on daily data between Feb. 18, 1972, and Dec. 31, 2019. Risk-adjusted returns based on the ratio of annualized returns to annualized volatility. Past performance is no guarantee of future results. Chart is provided for illustrative purposes and reflects hypothetical historical performance. Please see the Performance Disclosure at the end of this document for more information regarding the inherent limitations associated with back-tested performance.

pdf-icon PD F Download Full Article

1 Please see Appendix A for an overview of the low volatility indices offered by S&P Dow Jones Indices. 2 Chan, Fei Mei and Craig J. Lazzara, “Is the Low Volatility Anomaly Universal?,” S&P Dow Jones Indices, April 2019. 3 Previously, the returns data began in November 1990.


China's New Economy Sectors: How Are They Doing?

Contributor Image
Priscilla Luk

Managing Director, Global Research & Design, APAC

S&P Dow Jones Indices

Contributor Image
Liyu Zeng

Director, Global Research & Design

S&P Dow Jones Indices

China’s economy is shifting from being primarily focused on investment and manufacturing to a consumption- and services-driven market.  In this paper, we use the S&P New China Sectors Index to analyze China’s growing economic sectors and examine their equity, fundamental, and price performance characteristics.

EXECUTIVE SUMMARY
  • The main sectors and industries benefiting from China’s economic Global Research & Design transformation are Consumer Discretionary, Consumer Staples,Communication Services, Health Care, Insurance, and Independent Power and Renewable Electricity Producers.
     
  • As China’s structural economic reforms deepen, the demand for benchmarks tracking sector drivers is increasing.The S&P New China Sectors Index is designed to provide equity insight into China’s new economy sectors.
  • The S&P New China Sectors Index has its largest overweights in Consumer Discretionary, Communication Services, and Consumer Staples, and its largest underweights are in Industrials, Materials, and Financials, compared with the broad Chinese equities market.
  • The S&P New China Sectors Index recorded an annualized return of 8.5% between Dec. 31, 2010, and Sept. 30, 2019, outperforming the S&P China 500 by 4.3%, indicating that the new economy sectors performed better than the broad equity market.
  • The outperformance of the S&P New China Sectors Index was dominated by sector-allocation effects.
  • New economy companies featured higher revenue growth, higher profitability, and lower leverage than the broader equities market, and they tended to be priced with higher valuation and lower dividend yield.

pdf-icon PD F Download Full Article

Blending Low Volatility with Dividend Yield in the China A-Share Market

Contributor Image
Priscilla Luk

Managing Director, Global Research & Design, APAC

S&P Dow Jones Indices

Contributor Image
Liyu Zeng

Director, Global Research & Design

S&P Dow Jones Indices

EXECUTIVE SUMMARY

This paper examines the potential benefits of blending high dividend and low volatility strategies in the China A-share large-cap equity market.

  • Excluding high volatility stocks from a high-dividend-yield portfolio may reduce portfolio volatility and improve portfolio returns on a risk-adjusted basis.
  • The S&P China A-Share LargeCap Low Volatility High Dividend 50 Index overlays a low volatility screen on high dividend stocks. For the period from Jan. 31, 2009, to June 28, 2019, the index delivered pronounced excess returns on an absolute and risk-adjusted basis.
  • This index delivered a stable source of income from dividends and showed defensive qualities, with reduced drawdown during down markets.
  • The active exposure to dividend yield, low volatility, and value factors contributed most to the active returns, while the sector allocation bias accounted for most of the active risk for the index.

INTRODUCTION

Dividend investment is a popular investment strategy among incomeseeking market participants. Since they were first launched in 2003, dividend ETFs with diverse designs have proliferated across regions of varied characteristics.

In September 2012, S&P Dow Jones Indices launched the S&P 500® Low Volatility High Dividend Index. It uses a unique, rule-based dividend strategy that is designed to combine high dividend yield and low return volatility in a single index. Compared with pure dividend-yield-based strategies, this index has been shown to provide enhanced risk-adjusted performance and incremental defensiveness, which can be particularly attractive to conservative investors.

In the following sections, we examine the effectiveness of a low volatility high dividend yield strategy in the China A-share large-cap equity market, based on companies in the S&P China A Domestic LargeCap Index. We also demonstrate indexing implementation of this strategy using the S&P China A-Share LargeCap Low Volatility High Dividend 50 Index.

pdf-icon PD F Download Full Article

Making STRIDEs in Evaluating the Performance of Retirement Solutions

EXECUTIVE SUMMARY

The S&P Shift to Retirement Income and Decumulation (STRIDE) Index Series incorporates an innovative risk management framework focused on providing increasing levels of clarity and stability around sustainable annual consumption in retirement. This paper tests S&P STRIDE’s approach to consumption risk management and asset allocation over the period from 2003 to 2018 for a hypothetical cohort of 2010 retirees by comparing the S&P STRIDE Glide Path 2010 Index Total Return to the average 2010 target date fund (TDF). Our main findings are as follows.

  • The risk management approach employed by S&P STRIDE would have helped reduce uncertainty about retirement income through a period of variable interest rates, inflation, and market returns. In particular, we show how the risk management component of the S&P STRIDE Index can provide clarity and stability around affordable future consumption prior to and into retirement. The approach aims to help retirement plan participants seamlessly transition from accumulation to retirement.
  • The risk management strategy can be used to reduce the impact of market, inflation, interest rate, and sequencing risks on retirement consumption.
  • In contrast, we find that an industry average of traditional 2010 TDFs exhibited high variability in terms of retirement consumption over the period. Estimates of affordable consumption from such a strategy were highly sensitive to market risk, interest rates, and inflation. As a result, these strategies demonstrated large fluctuations in the level of expected retirement consumption over the period.
  • INTRODUCTION

    Retirement can mean different things to different people. For some, retirement means a complete stop from working. For others, it means ending a professional career in pursuit of something new. Regardless of the definition, retirement normally marks the point when the primary source of income ends and savers begin to rely on their accumulated balances to maintain their standard of living. Therefore, in the context of retirement, a primary goal is often to be able to sustain an inflation-adjusted stream of income, or a level of consumption associated with a standard of living, throughout retirement and to have relevant and meaningful information about what that level of sustainable consumption stream is before and throughout retirement.

    pdf-icon PD F Download Full Article

A Look Inside Green Bonds: Combining Sustainability with Core Fixed Income

Contributor Image
Brian D. Luke

Senior Director, Head of Commodities, Real & Digital Assets

S&P Dow Jones Indices

In recent years, an increasing number of market participants have shown interest in sustainability-driven investing and have started to incorporate elements of environmental, social, and governance (ESG) factors in their investment processes. Various rationales have been given for the inclusion of these factors.

The first rationale is that from a risk/return perspective, companies that consider impact investing and ESG practices associated with their business activities are likely to be ahead of their peers. From an environmental standpoint, actively managing a portfolio’s footprint may help decrease exposure to companies that may face legal and reputational risks and provide a hedge against future regulatory changes. For example, as the world transitions to a low-carbon economy, organizations that have been proactive will be better positioned to adapt to new regulations, innovation, or a shift in consumer appetite.

The second rationale for investing in these types of companies comes from social or personal values and goals. These investors aim to create portfolios that balance financial returns within the scope of mission objectives.

No matter the rationale, there is a wide range of options for fixed income market participants to navigate. A common approach to navigating among these options has been to rely on evaluation metrics, or ratings that measure the ESG impact of companies’ operations, and overlaying the score onto assets. The main challenge of this approach is that currently there is no clear standard of measurement in the market.

Researchers at MIT who worked on the Aggregate Confusion Project found that when they compare “two of the top five ESG rating agencies and compute the rank correlation across firms in a particular year, we are likely to obtain a correlation of the order of 10 to 15 percent. At least the correlation is positive! It is very likely (about 5 to 10 percent of the firms) that the firm that is in the top 5 percent for one rating agency belongs to the bottom 20 percent for the other.”

pdf-icon PD F Download Full Article

Processing ...