IN THIS LIST

Returns, Values, and Outcomes: A Counterfactual History

What Happened to the Index Effect? A Look at Three Decades of S&P 500 Adds and Drops

Limiting Risk Exposure with S&P Risk Control Indices

A Dynamic Multi-Asset Approach to Inflation Hedging

Profiling Minimum Volatility

Returns, Values, and Outcomes: A Counterfactual History

Contributor Image
Craig Lazzara

Managing Director, Index Investment Strategy

S&P Dow Jones Indices

EXECUTIVE SUMMARY

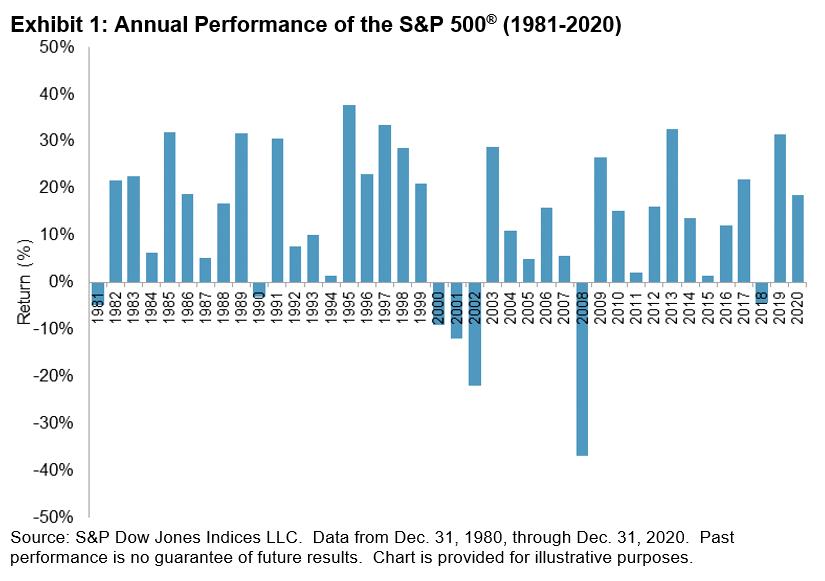
  • Any analysis of investment policy or strategy must be based on historical data. Even if an analyst wants to extrapolate into the future (which we do not), extrapolations must start with the past.
  • But the historical data that we observe were not inevitable; history might have turned out differently than it actually did.
  • In this paper, we construct a counterfactual history of the last 40 years of U.S. equity returns, and explore what those histories could imply for investment policy.
  • Although the range of possible outcomes is quite wide, one consistent conclusion is that long-term investors in large-capitalization U.S. equities would have been advantaged by choosing passive rather than active management.

Returns, Values, and Outcomes: A Counterfactual History: Exhibit 1

INTRODUCTION

We often write about equity markets and the potential implications of various investment strategy choices.  What are the implications of the choice between active and passive management? How have factor or “smart beta” strategies performed in various economic environments? What do market dynamics tell us about the investment opportunity set?

All of these questions, and others like them, are important, but all are questions about returns.  Investors, however, live not with a series of returns, but rather with portfolio values.  In this paper, we model the connection between returns and portfolio values over a long-term historical horizon.

pdf-icon PD F Download Full Article

What Happened to the Index Effect? A Look at Three Decades of S&P 500 Adds and Drops

Contributor Image
Hamish Preston

Head of U.S. Equities

S&P Dow Jones Indices

EXECUTIVE SUMMARY

The index effect refers to the excess returns putatively associated with a security being added to, or removed from, a headline index.  Although it has been studied for decades, the index effect has received more attention in recent years amid the growth of passive investing and the accompanying speculation that stock returns may be affected by buying and selling pressures from index-tracking investors reacting to changes in index membership.

This paper analyzes S&P 500® additions and deletions from the start of 1995 to June 2021. We focus on the S&P 500 given it is the world’s most widely followed index—USD 13.5 trillion was indexed or benchmarked to the large-cap U.S. equity gauge at the end of 2020 —and so if the growth of passive investing contributed to an index effect, one might expect it to appear in S&P 500 additions and deletions.

Overall, our analysis corroborates the general consensus reflected in existing literature: the S&P 500 index effect seems to be in a structural decline (see Exhibit 1). Our analysis also suggests that an improvement in stock liquidity may help to explain the attenuation in the index effect over time.

What Happened to the Index Effect? A Look at Three Decades of  S&P 500 Adds and Drops: Exhibit 1

pdf-icon PD F Download Full Article

Limiting Risk Exposure with S&P Risk Control Indices

INTRODUCTION

The volatility seen during the Global Financial Crisis (GFC) in 2008 broke the calm that was present in financial markets from 2004 to early 2007.  Most asset classes experienced significant pullbacks, markets became volatile, and the correlation between asset classes increased significantly.  Portfolio construction based on the backward-looking correlation model failed, as the expected diversification benefit was eliminated precisely when it was needed the most.

In the aftermath of the GFC, institutional market participants with long-term investment horizons have responded with aversion to this volatility by considering a number of risk control strategies.  The risk control strategies adjust market exposure in inverse relation to risk to target a stable level of volatility in all market environments.  For institutional market participants with long-standing liabilities, which can range from defined benefit plans to variable annuities offered at insurance companies, a risk control strategy may provide a smoother path of asset returns (see Exhibit 1) and could more closely align the performance of the institution’s assets to the characteristics of its liabilities.

Limiting Risk Exposure with S&P Risk Control Indices: Exhibit 1

S&P Dow Jones Indices has developed a risk control framework through a series of risk control indices, which seek to measure various underlying equity- or futures-based indices at set risk levels.  S&P Dow Jones Indices’ risk control indices feature:

  • Globally accepted, independent underlying indices like the S&P 500, S&P 500 Low Volatility, and S&P 500 Dividend Aristocrats®;
  • Transparent methodology based on the underlying index’s historical volatility;
  • Measurements of risk, based on volatility, to help market participants control risk at a predefined level; and
  • Utilization of the same constituents as the underlying index.

S&P Dow Jones Indices has created a suite of risk control indices based on a large number of equity and thematic indices, along with the S&P GSCI® and the other commodity indices in its series (see the Appendix for a complete list).

pdf-icon PD F Download Full Article

A Dynamic Multi-Asset Approach to Inflation Hedging

Contributor Image
Lalit Ponnala

Director, Global Research & Design

S&P Dow Jones Indices

Contributor Image
Fiona Boal

Managing Director, Global Head of Equities

S&P Dow Jones Indices

Contributor Image
Jason Ye

Director, Factors and Thematics Indices

S&P Dow Jones Indices

EXECUTIVE SUMMARY

Inflation is one of the most significant risks to investment returns over the long term. Core equities and conventional bonds tend to deliver below-average returns in rising inflation environments, which can encourage investors to seek out inflation-sensitive assets, such as commodities, inflation-linked bonds, REITs, natural resource stocks, and gold, to protect their portfolios from inflation shocks.

In this paper, we construct a multi-asset index for inflation protection.  First, we look into forecasting inflation.  Next, we analyze the inflation sensitivity of various asset classes.  Then, we identify strategies for different inflation regimes.  Finally, we present portfolios that adjust their allocation dynamically to changes in the inflation regime.

INTRODUCTION

As record levels of monetary and fiscal stimulus are pumped into the recovering global economy, inflation has returned to the discussion.  The low-inflation environment of the past few decades has penalized inflation-sensitive assets.  Given that inflation can be notoriously difficult to forecast, and market participants may experience unexpected inflation shocks, it is worthwhile to revisit the concept of inflation protection.

For many investors, the unprecedented and coordinated fiscal stimulus in the wake of the COVID-19 pandemic has justified concerns over inflation.  Neville et al. summarized four factors that suggest heightened inflation risk: (1) unprecedented increase in money creation, (2) historically high fiscal deficit level, (3) recent increase in long-term yields, and (4) the inflation derivatives market pricing in a 31% probability that the average inflation rate will exceed 3% over the next five years.

pdf-icon PD F Download Full Article

Profiling Minimum Volatility

Contributor Image
Craig Lazzara

Managing Director, Index Investment Strategy

S&P Dow Jones Indices

EXECUTIVE SUMMARY

  • Minimum volatility is part of a broader group of defensive strategies that have been in existence for decades. They are based on the low volatility anomaly, the phenomenon that lower-risk stocks outperform over time, contradicting the conventional wisdom that risk and reward go hand in hand.
  • Low volatility strategy indices attempt to exploit this anomaly systematically. The typical behavior patterns of low volatility strategies are that they go up less when the market is up and go down less when the market is down. They offer protection in down markets and participation in up markets.
  • More than with most factor strategies, the potential value added of low volatility strategies is largely dependent on market dynamics. Dispersion of returns tends to be higher in times of crisis; this disparity gives defensive strategies such as low volatility a leg up.

Profiling Minimum Volatility: Exhibit 1

INTRODUCTION

Following a few years of significant market gains, enthusiasm for low volatility strategies has waned, particularly compared with the period after the 2008 Global Financial Crisis. This is understandable since protection is probably not top of mind when things are going well and are seemingly on an upward trajectory.

THE LOW VOLATILITY ANOMALY

Low volatility strategies explicitly aim to deliver a pattern of returns relative to the market. Their goal is to reduce risk (volatility), and that goal is constant in both good times and bad.

Low volatility is a characteristic. Low volatility accompanied by outperformance is an anomaly. The phenomenon of lower-risk assets also outperforming higher-risk assets over time was noted by academics almost half a century ago.  Flouting the conventional wisdom that risk and return
go hand in hand, this phenomenon was dubbed the low volatility anomaly. Outperformance does not occur at all times (particularly in strong market performance cycles), but the anomaly has been observed universally across different markets and asset classes.

When it comes to low volatility portfolios, there are different approaches to index construction that yield different characteristics and results. In the U.S., the S&P 500 Minimum Volatility Index is one way to pursue lower risk in a systematic way.

The methodology underlying the S&P 500 Minimum Volatility Index relies on optimization, minimizing volatility subject to stock- and sector-level exposure constraints. Compared with a rankings-based methodology such as the one used for the S&P 500 Low Volatility Index, the optimized approach has typically resulted in less performance divergence from the benchmark.

Profiling Minimum Volatility: Exhibit 2

In the period from January 1991 through May 2021, the minimum volatility index delivered nearly the same return as the benchmark S&P 500, but at substantially lower risk—a 16% reduction. On a 10-year rolling basis, the S&P 500 Minimum Volatility Index’s volatility was consistently lower than the S&P 500 throughout the entire period (see Exhibit 3).

Profiling Minimum Volatility: Exhibit 3

pdf-icon PD F Download Full Article

Processing ...