IN THIS LIST

From Grass to Mass: An Index-Based Approach to Measuring Greenium in Green Bonds

Low Volatility and High Beta: A Study in Backtest Integrity

Harnessing Multi-Factor Strategies Close to the Core

Returns, Values, and Outcomes: A Counterfactual History

What Happened to the Index Effect? A Look at Three Decades of S&P 500 Adds and Drops

From Grass to Mass: An Index-Based Approach to Measuring Greenium in Green Bonds

Contributor Image
Brian D. Luke

Senior Director, Head of Commodities, Real & Digital Assets

S&P Dow Jones Indices

Contributor Image
Catalina Zota

Associate Director, Fixed Income Product Management

S&P Dow Jones Indices

EXECUTIVE SUMMARY

  • Green bonds have historically exhibited a green premium—or "greenium"—meaning they have lower yields compared to non-green bonds with otherwise similar characteristics.
  • Rapid growth and increasing differentiation within the green bond market has led to better ways to measure greenium across global bond markets.
  • An index-based approach illustrates the level of greenium across bond markets; comparing current levels to historical ones suggests shrinking greenium in many major markets.

INTRODUCTION

Green bonds are tied to specific environmentally friendly projects of an issuer. The borrower agrees that the use of proceeds will be invested in environmentally friendly projects such as alternative clean energy, low carbon assets (e.g., green buildings, factories, or vehicles), or sustainable usage of water, pollution, or natural resources. In exchange for this commitment, the issuer seeks economic benefit in the form of a lower borrowing cost. First tapped by supranational borrowers such as the European Investment Bank and the World Bank, the index market value of green bonds surpassed USD 1 trillion in September 2021, expanding from sovereign and quasi-sovereign bonds to corporate and securitized debt.

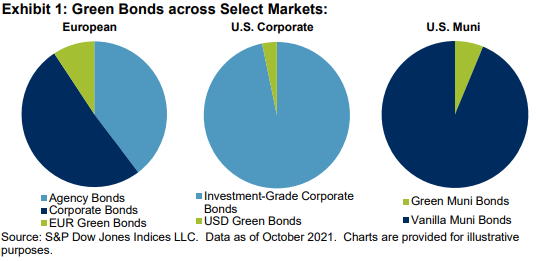
The green bond market, as measured by the S&P Green Bond Index, has grown since its 2007 debut: growth in the market value of green bonds averaged 70% annually over the past decade, compared with 3% for the global bond market (see Exhibit 1). Along with surging growth, investor demand for green bonds has remained strong.

From Grass to Mass: An Index-Based Approach to Measuring Greenium in Green Bonds: Exhibit 1

S&P Global Ratings' research on the European credit market observed initial sustainable bond yields to be lower compared with conventional bonds, incentivizing issuers. Despite a lower yield, or greenium, investors absorbed the liquidity of green bonds, further stimulating supply. In cases of no greenium at issuance, the research highlighted economic incentives for the investor in the form of outperformance. Tracking historical performance of two nearly identical German government bunds demonstrated additional spread tightening of 5 bps of the bund that was classified as green in the year since issuance.

Historical pricing appeared to demonstrate a price premium for green over non-green, or vanilla, bonds, as green debt represents just 2% of the overall market. More recent evidence suggests mutual benefits for investors and issuers alike as green and vanilla bond yields converge over time. This paper analyzes factors contributing to the changing relative valuation between green and vanilla bonds. Markets covered include European government agency and corporate bonds, as well as U.S. corporate and municipal markets.

Many issuers have repeatedly tapped the green bond market, allowing for issuer-based credit curves. In select cases, they provide good comparisons, but this is rare. Often, new green bonds cannibalize matured vanilla bonds, creating new issue bias. Applying a comprehensive credit valuation approach, this paper analyzes green and vanilla bonds by issuer, sector, and credit rating.

pdf-icon PD F Download Full Article

Low Volatility and High Beta: A Study in Backtest Integrity

Contributor Image
Craig Lazzara

Managing Director, Index Investment Strategy

S&P Dow Jones Indices

EXECUTIVE SUMMARY

  • In April 2011, S&P Dow Jones Indices launched the S&P 500® Low Volatility Index (Low Volatility) and the S&P 500 High Beta Index (High Beta). Their recent 10th “birthday” allows us to compare the backtested performance with which they were introduced with actual live performance.
  • Low volatility and high beta strategies are designed to access specific patterns of returns relative to the market. Low volatility should attenuate the market’s returns (in both directions), while high beta should amplify them.
  • The actual performance of both Low Volatility and High Beta has been consistent with these expectations.

Low Volatility and High Beta:  A Study in Backtest Integrity: Exhibit 1

pdf-icon PD F Download Full Article

Harnessing Multi-Factor Strategies Close to the Core

Contributor Image
Andrew Innes

Head of EMEA, Global Research & Design

S&P Dow Jones Indices

Contributor Image
Rupert Watts

Head of Factors and Dividends, Product Management

S&P Dow Jones Indices

EXECUTIVE SUMMARY

Factors that outperform over time are also prone to extended periods of underperformance, which are difficult to time. For investors seeking exposure to factor risk premia but with greater diversification and reduced cyclicality, multi-factor strategies may be more suitable than single factors.

Accordingly, S&P DJI presents a new series of multi-factor indices, collectively known as the S&P QVM Top 90% Indices, covering the U.S. large-cap, mid-cap, and small-cap universes (S&P 500®, S&P MidCap 400®, and S&P SmallCap 600®, respectively). In this paper, we analyze the indices' methodology and performance characteristics. Multi-factor scores are based on the average of three separate factors: quality, value, and momentum (QVM). This new index series encompasses a high proportion of the universe, whereas existing multi-factor indices are typically more concentrated.

Different multi-factor strategies produce different outcomes and positioning. Construction matters. These new indices select constituents in the top 90% of the universe, ranked by their multi-factor score and weighted by float-adjusted market capitalization (subject to constraints).

The indices generated moderate outperformance by removing the lowest-ranked decile of stocks. This plus float-adjusted market cap weighting allows the indices to retain many of the core features of the benchmark. In summary, the key historical performance characteristics of the S&P QVM Top 90% Indices include:

  • Moderate outperformance versus the benchmark;
  • Low tracking error;
  • Low turnover;
  • Low active share; and
  • Sector weights consistent with the benchmark.

INTRODUCTION

With the rising adoption of factor indices, the traditional boundaries between passive and active investing have become increasingly blurred. For decades, institutional investors constructed portfolios from a combination of market-cap-weighted index funds and active funds. Now, factor-based investing straddles these two approaches and enables institutional and retail investors alike to implement active strategies through passive vehicles.

Single-factor equity strategies (quality, value, or momentum) have been widely adopted to harvest each factor risk premium that could reward market participants over the long term. However, each factor is susceptible to periods of underperformance dependent on the market environment and economic cycle. This induces some market participants to attempt the notoriously difficult task of timing factors through tactical allocation strategies.

Harnessing Multi-Factor Strategies Close to the Core: Exhibit 1

An alternative solution is to employ a transparent multi-factor strategy that aims to capture exposures across all targeted factors simultaneously. Such a strategy exploits the potential diversification benefits by combining factor returns that have relatively low correlation to one another (see Exhibit 2). Subsequently, the diversified factor exposures may provide more stable excess returns over shorter time horizons, while still capturing their average long-term risk premia. Importantly, this approach avoids the need to subjectively time factor exposures.

Harnessing Multi-Factor Strategies Close to the Core: Exhibit 2

Exhibit 3 demonstrates the key differences between single-factor strategies and the multi-factor strategy in these indices. Here the full-year return of three single factor indices (S&P Quality, S&P Enhanced Value, and S&P Momentum), the S&P QVM Top 90% Multi-factor Index, and their respective benchmarks are ranked each year. Across all three universes (S&P 500, S&P MidCap 400, and S&P SmallCap 600), the wide variability in the calendar year performance rank of each single-factor strategy is evident. Conversely, the multi-factor strategy more consistently exhibits stable excess returns (higher performance rank) across most calendar years with respect to its benchmark.

Harnessing Multi-Factor Strategies Close to the Core: Exhibit 3

pdf-icon PD F Download Full Article

Returns, Values, and Outcomes: A Counterfactual History

Contributor Image
Craig Lazzara

Managing Director, Index Investment Strategy

S&P Dow Jones Indices

EXECUTIVE SUMMARY

  • Any analysis of investment policy or strategy must be based on historical data. Even if an analyst wants to extrapolate into the future (which we do not), extrapolations must start with the past.
  • But the historical data that we observe were not inevitable; history might have turned out differently than it actually did.
  • In this paper, we construct a counterfactual history of the last 40 years of U.S. equity returns, and explore what those histories could imply for investment policy.
  • Although the range of possible outcomes is quite wide, one consistent conclusion is that long-term investors in large-capitalization U.S. equities would have been advantaged by choosing passive rather than active management.

Returns, Values, and Outcomes: A Counterfactual History: Exhibit 1

INTRODUCTION

We often write about equity markets and the potential implications of various investment strategy choices.  What are the implications of the choice between active and passive management? How have factor or “smart beta” strategies performed in various economic environments? What do market dynamics tell us about the investment opportunity set?

All of these questions, and others like them, are important, but all are questions about returns.  Investors, however, live not with a series of returns, but rather with portfolio values.  In this paper, we model the connection between returns and portfolio values over a long-term historical horizon.

pdf-icon PD F Download Full Article

What Happened to the Index Effect? A Look at Three Decades of S&P 500 Adds and Drops

Contributor Image
Hamish Preston

Head of U.S. Equities

S&P Dow Jones Indices

EXECUTIVE SUMMARY

The index effect refers to the excess returns putatively associated with a security being added to, or removed from, a headline index.  Although it has been studied for decades, the index effect has received more attention in recent years amid the growth of passive investing and the accompanying speculation that stock returns may be affected by buying and selling pressures from index-tracking investors reacting to changes in index membership.

This paper analyzes S&P 500® additions and deletions from the start of 1995 to June 2021. We focus on the S&P 500 given it is the world’s most widely followed index—USD 13.5 trillion was indexed or benchmarked to the large-cap U.S. equity gauge at the end of 2020 —and so if the growth of passive investing contributed to an index effect, one might expect it to appear in S&P 500 additions and deletions.

Overall, our analysis corroborates the general consensus reflected in existing literature: the S&P 500 index effect seems to be in a structural decline (see Exhibit 1). Our analysis also suggests that an improvement in stock liquidity may help to explain the attenuation in the index effect over time.

What Happened to the Index Effect? A Look at Three Decades of  S&P 500 Adds and Drops: Exhibit 1

pdf-icon PD F Download Full Article

Processing ...